A Panel of Circulating microRNAs as a Potential Biomarker for the Early Detection of Gastric Cancer
-
Saliminejad, Kioomars
-
Hematology, Oncology and Stem Cell Transplantation Research Center, Shariati Hospital, Tehran University of Medical Sciences, Tehran, Iran
-
Reproductive Biotechnology Research Center, Avicenna Research Institute, ACECR, Tehran, Iran
-
Mahmoodzadeh, Habibollah
-
Department of Surgery, Cancer Institute, Imam Khomeini Hospital, Tehran University of Medical Sciences, Tehran, Iran
-
Soleymani Fard, Shahrzad
-
Hematology, Oncology and Stem Cell Transplantation Research Center, Shariati Hospital, Tehran University of Medical Sciences, Tehran, Iran
-
Yaghmaei, Marjan
-
Hematology, Oncology and Stem Cell Transplantation Research Center, Shariati Hospital, Tehran University of Medical Sciences, Tehran, Iran
-
Mousavi, Seyed Asadollah
-
Hematology, Oncology and Stem Cell Transplantation Research Center, Shariati Hospital, Tehran University of Medical Sciences, Tehran, Iran
-
Vaezi , Mohammad
-
Hematology, Oncology and Stem Cell Transplantation Research Center, Shariati Hospital, Tehran University of Medical Sciences, Tehran, Iran
-
 Ghaffari, Seyed Hamidollah
Hematology, Oncology and Stem Cell Transplantation Research Center, Shariati Hospital, Tehran University of Medical Sciences, Tehran, Iran, Tel: +98 21 84902665; Fax: +98 21 88004140; E-mail: shghaffari200@yahoo.com, shghaffari@tums.ac.ir
Ghaffari, Seyed Hamidollah
Hematology, Oncology and Stem Cell Transplantation Research Center, Shariati Hospital, Tehran University of Medical Sciences, Tehran, Iran, Tel: +98 21 84902665; Fax: +98 21 88004140; E-mail: shghaffari200@yahoo.com, shghaffari@tums.ac.ir
Abstract: Background: The high mortality rate of Gastric Cancer (GC) is a consequence of delayed diagnosis. The early diagnosis of GC could increase the five-year survival rate among patients. We aimed to find a panel of microRNAs (miRNA) for the detection of GC in the early stages.
Methods: In this case-control study, we selected consistently upregulated miRNAs from the results of 12 high-throughput miRNA profiling studies in GC. In the profiling phase, the differential expressions of 13 candidate miRNAs were analyzed by quantitative reverse-transcription PCR (qRT-PCR) in two pooled RNA samples prepared from the plasma of eight GC patients and eight matched controls. In the validation phase, significantly upregulated miRNAs from the profiling phase were further evaluated in the plasma samples of 97 patients with stage I-IV gastric adenocarcinoma and 100 healthy controls.
Results: In the profiling phase, six miRNAs (miR-18a, 21, 25, 92a, 125b and 221) were significantly upregulated in the GC patients compared to the controls (p<0.05). However, in the validation phase, only significant up-regulation of miR-18a, 21 and 125b was confirmed (p<0.05). A panel of miR-18a/21/125b was able to detect GC patients with stage I-IV from the controls (p<0.001; AUC=0.92, sensitivity=86%; specificity=85%). In addition, the panel could distinguish the early-stage GC (I+II) from the control group with an AUC of 0.83, a sensitivity of 83%, and a specificity of 75%.
Conclusion: A panel of circulating miR18a/21/125b could be suggested as a potential biomarker for the early detection of GC.
Introduction :
Gastric Cancer (GC) is the third cause of cancer related death worldwide 1. The high mortality rate of GC could be considerably reduced by the early detection of the disease and initiating prompt therapy 2. The burden of GC is relatively high in several Asian, Latin American and Central and Eastern European countries, whereas in North America and in most Western European countries it is no longer a common cancer 3. The diagnosis is often made when the disease is at an advanced stage, leading to a poor prognosis 4. The current available blood biomarkers (such as CEA, CA19-9, CA72-4, CA125 and pepsinogen) for the early detection of GC are not enough sensitive and specific for improving the prognosis of the disease 5. Upper endoscopy is an invasive procedure used for the diagnosis of GC 6. Therefore, the discovery of new biomarkers for the early detection of GC is clinically important 7,8.
MicroRNAs (miRNAs) are a major class of small endogenous non-coding RNAs with an average length of 22 nt that participate in gene expression at the post-transcriptional level. In humans, mature miRNAs are bound to the 3′-UTR of the target mRNAs by incomplete base-pairing, leading to the degradation of their target mRNA or inhibition of translation 9. Currently, there is a great emphasis on the potential importance of circulating miRNAs as non-invasive diagnostic and prognostic biomarkers in various diseases including cancer 10.
Up to now, several deregulated miRNAs have been identified in the plasma and serum of GC patients by miRNA profiling studies. For example, deregulation of miR-16, miR-19b 11, miR-223-3p, miR-375, miR-148a-3p 12, miR-378 13, miR-20a 14, miR-21, miR-331 15, and a panel of five miRNAs, including miR-21/31/92a/ 181b/203 16 have been suggested for the early detection of GC in the plasma and serum samples. However, the diagnostic accuracy of these miRNAs in GC patients should be further validated in large-scale prospective studies 17.
A logical approach to discover the most consistent deregulated miRNAs for a specific disease is to determine the intersection of those miRNAs, which have been reported in previously published miRNA profiling studies 18. Accordingly, we systematically selected the most consistent upregulated miRNAs from 12 previously published miRNA profiling studies of GC on the plasma 19,20, serum 13, and tissue samples 21-29. This study aimed to assess the expression levels of 13 candidate miRNAs in the plasma samples of GC patients as well as age- and sex- matched healthy controls to find a panel of circulating miRNAs for the early detection of GC.
Materials and Methods :
Subjects: This is a case-control study and the participants were enrolled from the Department of Surgery, Cancer Institute, Imam Khomeini Hospital, Tehran, Iran from September 2017 to October 2018. The sample size was estimated using the online easyROC software (http://www.biosoft.hacettepe.edu.tr/easy-ROC) to achieve a statistical power of 80%, assuming an alpha level of 0.05, and an Area under the ROC curve (AUC) of 0.60. We obtained plasma samples from 97 GC patients. The inclusion criteria were histopathologically confirmed diagnosis of gastric adenocarcinoma, and patients with intestinal type of GC. A blood sample was collected from each patient before surgery, chemotherapy, and radiotherapy. The exclusion criteria were diffuse type of GC and incomplete clinical and pathological data. Additionally, plasma samples from 100 healthy individuals with no family history of GC were included as the control group. The controls were age-, and sex-matched to the GC patients. The Ethics Committee of the Tehran University of Medical Sciences approved the study (Ethics code: IR.TUMS.VCR.REC. 1395.1078). All participants signed the informed consent statement.
Systematic search of the literature: For the selection of candidate miRNAs, we searched the PubMed database for miRNA profiling studies in GC, using a combination of five keywords (microRNA, gastric, cancer, profiling and microarray during 2009-2015. Non-English publications and review articles were excluded. The inclusion criteria of the literature were comprised of miRNA profiling studies that compared the expression levels of miRNAs between GC tissues and their corresponding adjacent non-tumor tissues, as well as miRNA profiling studies on the plasma or serum samples of GC patients and healthy controls. Finally, 12 miRNA profiling studies of GC on serum, plasma, and tissue samples were selected. Significant dysregulated miRNAs in the profiling phases of the eligible studies were extracted from the articles or their supplementary data. The candidate miRNAs should be consistently upregulated in at least two miRNA profiling studies that compared GC tissues and their corresponding adjacent non-tumor tissues or miRNA profiling studies that used serum or plasma samples from GC patients and healthy controls.
Selection of the candidate miRNAs: A total of 58 deregulated miRNAs (12 downregulated and 46 upregulated) have been reported in the three miRNA profiling studies of GC using plasma 19,20 and serum samples 13. In addition, 246 deregulated miRNAs (105 downregulated and 141 upregulated) have been reported in nine miRNA profiling studies of GC on tissue samples 21-29. As shown in the venn diagram (Figure 1), the intersection of deregulated miRNAs in GC shows that miR-150-5p is upregulated in two miRNA profiling studies of GC on the plasma and serum samples. Twelve miRNAs including miR-18a-5p/18b-5p/20a-5p/20b-5p/103a-3p/106a-5p/125b-5p/135a-5p/135b-5p/214-3p/221-3p and 224-5p were upregulated in at least two miRNA profiling studies of GC in tissue samples. Nine miRNAs including miR-16-5p/17-5p/19a-3p/21-5p/25-3p/92a-3p/106b-5p/181a-5p and 223-3p were upregulated in at least two miRNA profiling studies of GC in both plasma and tissue samples (Figure 1). Unfortunately, nine out of the 22 candidate miRNAs (miR-17/18b/19a/20a/20b/103a/106a 135a and 135b) could not be discriminated from the closely-related members of their family by our qRT-PCR method; therefore, we had to exclude them from our study.
Total RNA extraction: From each participant, 5 ml of peripheral blood was collected in tubes containing 200 µl of 0.5 M EDTA. All centrifugations were performed at 4°C. The fresh blood was centrifuged for 10 min at 3,000×g, and then the upper plasma layer was carefully transferred into a microtube. Total RNA was extracted from the 0.4 ml of plasma samples using RiboExTM LS reagent (GeneAll, South Korea) according to the manufacturer’s instructions. The quality and quantity of the extracted RNA samples were measured by a NanoDrop ND-1000 spectrophotometer (NanoDrop Technologies, Wilmington, DE, USA). The mean concentration of the total RNA per 400 µl of plasma was 137 ng/µl, ranging from 45 to 290 ng/µl.
cDNA synthesis: The expression levels of the mature miRNAs were assessed by the poly (A)-tailed universal reverse transcription PCR method. In the first step, a length of AMP was added to the 3’ end of RNA. A reaction mixture containing 1 µl of Escherichia coli (E. coli) poly (A) polymerase (NEB# M0276), 1 µl of 10 X E. coli poly (A) polymerase reaction buffer, 1 µl of rATP (10 mM), and 400 ng of total RNA, and DDW up to a final volume of 10 μl was incubated at 37°C for 30 min. In the next step, reverse-transcription of poly (A)-tailed RNAs were performed using the PrimeScript 1st strand cDNA synthesis kit (Takara, Tokyo, Japan) and our designed poly (T) adaptor, according to the manufacturer's instructions. The poly (T) adaptor is a degenerate primer with a length of 79 nucleotides (Table 1).
Primer designing and real time PCR: Quantitative real-time PCR (qRT-PCR) was performed using specific forward primers and a common reverse primer in triplicate reactions (Table 1). In most of the candidate miRNAs, the sequence of the forward primer is identical to the sequence of the mature miRNA. To discriminate some of the candidate miRNAs, from the closely-related members of their family (For example, miR-18a-5p), a single nucleotide mismatch was introduced close to the 3’ end of the primer. To increase the melting Temperature (Tm) of the AT-rich mature miRNA (for example, miR-21-5p), G or C nucleotides were added to the 5’ end of primer. The specificity of the primers was verified using BLASTN and SSEARCH algorithms available at the miRBase (www.miRBase.org), as well as the primer BLAST (www.ncbi.nlm.nih.gov).
The real-time PCR was performed using RealQ Plus 2 X master mix (Ampliqon, Denmark) in a LightCycler 96 system (Roche, Germany) according to manufacturer's instructions. Each PCR reaction contained 10 µl of 2 X SYBR premix, 3 pmol of the forward primer, 3 pmol of the common reverse primer, 25 ng of template cDNA, and DDW up to a volume of 20 µl. The real-time PCR program started with an initial denaturation at 95°C for 15 min, followed by 42 cycles of denaturation at 94°C for 5 s, primer annealing at 60-65°C for 35 s, and extension at 72°C for 5 s. The melting curve analysis was performed at the end of the PCR program. The detectable miRNAs were considered as those with a Ct <35 and five Ct less than the negative control (DDW). The specificity of primers was verified by melting curve analysis and agarose gel electrophoresis.
Reference gene selection and data normalization: To determine a suitable reference gene for the relative quantification of miRNAs, two commonly used reference genes for the miRNA expression studies, U48 and U6, were selected. U48 (also known as SNORD48) is a small nucleolar RNA and U6 (RNU6-1) is a small nuclear RNA. The raw Ct (cycle threshold) values for U6 and U48 were determined in 24 plasma samples of the GC patients and 24 plasma samples of the healthy controls. The BestKeeper tool was used to select the most stable reference gene for the miRNA expression analysis 30. The Fold Change (FC) of miRNA expression in the patients compared to the controls was calculated by the comparative Ct (2-△△Ct) method. The △Ct was calculated by the subtraction of the mean Ct value of U48 from the mean Ct value of miRNA.
miRNA profiling phase: Before analyses of all selected candidate miRNAs in each subject, we performed a miRNA profiling phase using two pooled RNA samples prepared from the plasma of eight patients with gastric adenocarcinoma (TNM stage I-IV) as well as eight sex -and age- matched controls. Each pooled RNA sample was prepared by mixing 100 ng of RNA isolated from each plasma sample. Following the polyadenylation step, the pooled RNA samples were subjected to cDNA synthesis. Differential expression of 13 candidate miRNAs was evaluated in these pooled cDNA samples by qPCR using U48 as the reference gene. Primer sequences for the candidate miRNAs are shown in table 1.
Validation phase: In the validation phase, six significantly upregulated miRNAs (FC >2.0) from the profiling phase were selected for further validation on 97 plasma samples of GC patients and 100 controls by qRT-PCR and U48 as the reference gene. The diagnostic performances of the significantly upregulated miRNAs from the validation phase were determined in the detection of GC patients from the controls.
Statistical analysis: Data analysis was performed using the SPSS software (version 16.0, IBM Corp). A two-tailed p<0.05 was considered statistically significant. The differences in miRNA expression levels between the GC patients and controls were evaluated by Mann-Whitney U test or Student’s t-test. The diagnostic performance of miRNAs in the detection of GC patients from the controls was assessed using the Receiver Operating Characteristic (ROC) curve analysis. Binary logistic regression analysis was performed to evaluate the diagnostic performance of miRNA combinations in the detection of GC.
Results :
Subjects: A total of 97 blood samples from GC patients with TNM stage I-IV and 100 blood samples from healthy controls were included in this study. The mean ages of the patient and control groups were 58.9±12.3 and 55.7±11.0, respectively. The distribution of age (p=0.179) and gender (p=0.892) were not significantly different between the controls and GC patients. The male/female ratio in the patient group was 1.8 (62 men vs. 35 women). Approximately, 32.0% of the patients were diagnosed with an early stage of GC (I and II), and 60.8% were detected with an advanced stage of GC (III and IV). The stage of GC was not available in 7.2% of the patients. The main clinical characteristics of the GC patients are summarized in table 2.
Reference gene selection: To choose a suitable reference gene for the relative quantification of miRNAs using the plasma samples, we determined the Ct values of U6 and U48 in 24 plasma samples from the GC patients and 24 plasma samples from the healthy individuals. The Ct values of U48 were not significantly different (p=0.936) between the GC patients (27.19±1.15) and healthy control (27.16±1.01). Also, no significant difference (p=0.084) was found in the Ct values of U6 between the GC patients (27.74±1.53) and the healthy control (28.55±1.67). In terms of variability, the Standard Deviation (SD) of the Ct values for U48 and U6 in all 48 samples were 0.89 (Mean=27.17, Min=24.98, Max=29.19) and 1.33 (Mean=28.15, Min=24.88, Max=31.45), respectively. There was a significant positive correlation between the raw Ct values of U6 and U48 (r=0.408, p=0.004). In addition, a significant positive correlation was found for U48 (r=0.79; p=0.001) and U6 (r=0.53; p=0.001) in comparison to the BestKeepr index. Considering both the variability (Lower SD) and correlation coefficient value (Higher r), U48 were selected as the suitable reference gene for the miRNA expression analysis in the plasma samples.
miRNAs profiling phase: The expression analyses of 13 candidate miRNAs using U48 in the pooled cDNAs samples showed that miR-18a (FC=2.1; p=0.036), miR-21 (FC=2.0; p= 0.045), miR-25 (FC=4.4; p=0.007), miR-92a (FC=2.7; p=0.021), miR-125b (FC=5.3; p=0.004) and miR-221 (FC=3.2; p=0.009) were significantly upregulated in the plasma of GC patients compared to the healthy controls. On the other hand, miR-214 (FC=0.8; p=0.039) were significantly downregulated in the plasma of GC patients compared to the healthy controls. The other six miRNAs including miR-16, miR-106b, miR-150, miR-181a, miR-223, miR-224 were not dysregulated among the GC patients and controls (p>0.05).
Validation phase: The analysis of the six identified miRNAs in the profiling phase (miR-18a/21/25/92a/125b/221) was further evaluated in the plasma samples of 97 GC patients and 100 controls by qRT-PCR. The results showed that miR-18a (FC=1.8; p=0.027), miR-21 (FC=2.1; p=0.042), and miR-125b (FC=2.0; p=0.004) were significantly upregulated in the plasma samples of GC patients with stage I-IV. No significant differences in the plasma levels of miR-25, miR-92a, and miR-221 were found between the GC patients and the controls. The AUC of miR-18a, miR-21, and miR-125b were 0.67 (p=0.027; SE=0.07; 95% CI=0.53-0.81), 0.65 (p=0.042; SE=0.07; 95% CI=0.51-0.78), and 0.69 (p=0.004; SE=0.08; 95% CI=0.54-0.84), respectively. These AUCs are suboptimal which does not provide much accuracy of the detection. For miR-18a, the sensitivity was 55% and the specificity was 57%. For miR-21, the sensitivity was 56% and the specificity was 54%. miR-125b had the highest sensitivity of 64% and specificity of 65% in comparison with miR-18a and miR-21 (Figure 2).
Diagnostic performance of miRNAs panels: By using the binary logistic regression and ROC analyses, the diagnostic performance of the combination of miR-18a, miR-21, and miR-125b was evaluated in the validation phase. In comparison to the combined miR-18a/21 (AUC=0.78; p=0.001) and miR-21/125b (AUC=0.79; p=0.001), the combination of miR-18a/125b yielded the highest AUC of 0.83 (p<0.001), with a sensitivity of 83% and a specificity of 71%. Furthermore, a panel of three miRNAs (miR-18a/21/125b) had a higher AUC value of 0.92 (p<0.001; SE=0.05; 95% CI=0.82-1.00), with a sensitivity of 86% and a specificity of 85% (Table 3, Figure 3).
The AUC of miR-18a/21/125b panel for the detection of late-stage GC patients was 0.93 (p=0.001; SE=0.07; 95% CI=0.79-1.00), with a sensitivity and specificity of 86 and 75%, respectively (Table 3). We also evaluated the diagnostic performance of these panels in the GC patients with early-stages (I+II) compared to the controls (Table 3). The combined miR-18a/125b, and miR-18a/21/125b showed significant difference between the early-stage GC patients and the control group (p<0.01). However, the combined miR-18a/21, and miR-21/125b did not distinguish the early-stage GC patients from the controls. The AUC of miR-18a/21/125b panel for the detection of early-stage GC patients was 0.83 (p=0.001; SE=0.07; 95%CI=0.79-1.00), with a sensitivity and specificity of 83 and 75%, respectively (Table 3).
Discussion :
In neoplastic tissues, the down-regulation of the tumor suppressor miRNAs can induce the activation of their target proto-oncogenes; whereas the up-regulation of the oncogenic miRNAs can silence the expression of their target tumor suppressor genes 31. It has been deduced that a decrease in the expression level of any miRNA in the plasma of cancer patients could not be explained by the down-regulation or even complete loss of expression of that particular miRNA in the tumor tissues. The down-regulation of circulating miRNAs is probably a nonspecific response to the presence of cancer in the body 32. According to this hypothesis, we exclusively focused on the upregulated miRNAs in GC with the purpose of identifying a panel of miRNAs as a biomarker for the early detection of GC.
In the current study, we systematically selected 13 candidate miRNAs from the high-throughput miRNA profiling studies of GC. Expression analysis of these miRNAs in the profiling phase revealed that miR-18a, miR-21, miR-25, miR-92a, miR-125b and miR-221, were significantly upregulated compared to the controls. However, in the validation phase only miR-18a (AUC=0.67), miR-21 (AUC=0.65), and miR-125b (AUC=0.69) were significantly higher in the GC patients compared to the controls. The miR-18a/21/125b panel showed an AUC of 0.93 in the detection of late-stage GC patients (TNM stage I+IV) with a sensitivity of 86%, and a specificity of 85%. Analysis of this panel in the detection of early-stage GC (TNM stage I+II) revealed that the performance was reduced with an AUC of 0.83, a sensitivity of 83% and a specificity of 75%. Circulating miR-18a 33 and miR-21 34 have been previously suggested as potential biomarkers for the early detection of GC; however, to our knowledge, circulating miR-125b has not been reported for the early detection of GC.
miR-18a belongs to the miR-17 ~92 cluster (located on 13q31.3), which encode miR-17, miR-18a, miR-19a, miR-20a, miR-19b and miR-92a 35. These miRNAs were over-expressed in both hematopoietic malignancies and solid cancer such breast, colon, lung, pancreas, prostate 35 and gastric 22. Although, the miR-17-92 cluster is a polycistronic miRNA gene; however, a higher expression of miR-18a compared to the other members of miR-17 ~92 cluster has been reported in GC tissues 36. It has been suggested that related miRNAs may be subject to unique post-transcriptional regulation 35. In a recent study, overexpression of miR-1792 members were found in the serum samples of GC and intestinal metaplasia patients compared with the controls, which suggested that they could be considered as a potential biomarker for the early detection of GC 37. Significant up-regulation of miR-18a in the plasma of GC patients (AUC=0.81) and their primary tissues has been reported. In addition, surgery resulted in a significant decrease in the plasma level of miR-18a level 33. miR-18a acts as an oncogene and contributes to GC tumorigenesis by directly targeting the PIAS3 (STAT3 inhibitor). Furthermore, a positive correlation has been observed between the expression level of miR-18a and the activity of the STAT3 target genes, including c-Myc proliferation-associated gene and the antiapoptotic genes, including Survivin and Bcl-xL 36. Overexpression of miR-18a in GC tissues has been associated with poor survival rate in GC patients. It has been shown that forced expression of miR-18a significantly increased cell proliferation, migration, and invasion in GC cell lines. miR-18a modulates P53 expression by targeting interferon regulatory factor 2 (IRF2) in GC patients 38.
miR-21 has been consistently reported as an oncogene in GC. Increased plasma level of miR-21 has been suggested as a potential biomarker for the detection of GC with an AUC of 0.79, a sensitivity of 84% and specificity of 89% 39. Plasma miR-21 along with miR-17, miR-106a, miR-106b were significantly upregulated in GC patients in comparison to the controls and the levels of these miRNAs were significantly reduced after surgery 40. miR-21 along with six other miRNAs (miR-19a, miR-106a, miR-130a, miR-223, miR-331 and miR-374) were overexpressed in the serum samples of GC patients compared to the controls, as well as primary gastric tumors and adjacent mucosa 15. The absolute quantification of miRNAs by droplet digital PCR (without the need for a reference gene) showed that the expression levels of miR-21, miR-93, miR-106a and miR-106b were significantly increased in the plasma of patients with GC compared to the controls. A panel of these miRNAs was suggested for the detection of GC with an AUC, sensitivity and specificity of 0.89, 85%, and 79%, respectively 34. It has been shown that the knockdown of miR-21 in the GC cell line using an anti-miR-21 inhibitor noticeably suppressed cell growth, invasion, migration, and rate of the colony formation of MKN74 through the PTEN/PI3K/mTOR pathway 41.
miR-125b is transcribed by two different loci MIR125B1 and MIR125B2 located on chromosomes 11q24.1 and 21q21.1, respectively 42. miR-125b is considered to be an oncogene in many cancers including gastric. Regarding the role of miR-125b in GC, in situ hybridization data has demonstrated that 82% of the GC tissues and only 26% of the normal gastric tissues exhibited a positive expression of miR-125b which confirmed by qRT-PCR. Furthermore, overexpression of miR-125b predicated poor prognosis in GC patients 43. Up-regulation of miR-125b in the GC tissues could increase the cellular proliferation, invasion, and migration by downregulation of PPP1CA (Protein Phosphatase Type 1α Catalytic Subunit) and upregulation of Rb phosphorylation in GC 44. miR-125b might be considered as a prognostic biomarker and therapeutic target in GC 44.
We performed miRNA pathway analysis using DIANA-mirPath v3 on experimentally validated miRNA interactions derived from DIANA-TarBase v.7.0 (data are not shown). The results showed that 47 genes in the Hippo signaling pathway (p=1.2×10⁻¹³) are regulated by miR-18a (19 genes), miR-21 (23 genes) and miR-125b (21 genes). This pathway is critical for balancing cellular differentiation and proliferation and metastasis. It is frequently dysregulated in many types of solid tumors including GC 45. It has been demonstrated that several miRNAs for examples miR-93-5p 46, miR-375 47 and miR-664a-3p 48 contributed to the gastric carcinogenesis by targeting Hippo signaling pathway.
It should be noted that some of the circulating miRNAs, for example, miR-21 have been elevated in different types of cancers and has even been reported to be associated with non-neoplastic diseases 32. The use of miRNAs as cancer biomarkers in the clinical practice has been limited on accounts of several factors. One of the main contributing challenges is the fact that frequently reported miRNA biomarkers are deregulated in various cancers. This issue may be overcome by introducing a panel of miRNAs, rather than a single miRNA. A panel of miRNAs could increase the likelihood of a biomarker being specific to a particular cancer 49.
Conclusion :
Our findings indicate that a panel of three circulating miRNAs (miR-18a, miR-21 and miR-125b) could be suggested as a potential biomarker for the detection of GC in the early stages. Further validation of the panel in large patient groups with mixed pathologies and in multiple research centers is required.
Acknowledgement :
The study was supported by a grant from the Hematology, Oncology and Stem Cell Transplantation Research Centre, Shariati Hospital, Tehran University of Medical Sciences, Tehran, Iran. We would like to thank Mrs. Anahita Abbasi for her constructive advice on improving the English writing of the manuscript.
Conflict of Interest :
The authors declare that there are no conflicts of interest.
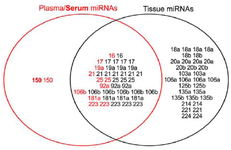
Figure 1. Venn diagram showing the intersection of deregulated miRNAs in GC profiling studies. The plasma and serum (Bold) miRNAs identified by GC profilings are shown in red color, while the tissue miRNAs are dipicted in black color. The "miR-" prefix has been deleted from the miRNAs’ name.
|
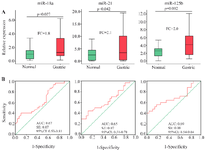
Figure 2. A) Differential expression of miRNAs. AUC: Area under the ROC curve; SE: Standard error; CI: Confidence interval; FC: Fold change. B) Receiver operating characteristic curve analysis of miR-18a, miR-21, and miR-125b for the detection of GC patients (stage I-IV) from controls in the validation phase.
|
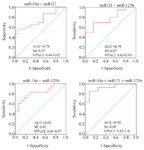
Figure 3. Receiver operating characteristic curve analysis of the combined miRNAs for the detection of GC patients (stage I-IV) from the controls. AUC: Area under the ROC curve; SE: Standard error; CI: Confidence interval.
|
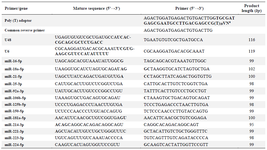
Table 1. Sequences of the primers, universal poly (T) adaptor, and the mature sequences of U48, U6, and the candidate miRNAs
One or two mismatches (underlined letters) were introduced in some of the primers to increase the specificity of the primer or to avoid primer-dimer formation.
aV= A, G, C; N=A, G, C, T
|
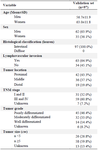
Table 2. Characteristics of the gastric cancer patients
|
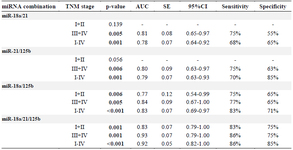
Table 3. The diagnostic performance of miRNAs combinations in distinguishing gastric cancer patients with TNM stage I+II (n=31), III+IV (n=59), and I-IV (n=97) from the healthy controls (n=100)
p<0.05 was considered statistically significant. AUC: Area under the ROC curve; SE: Standard error; CI: Confidence interval.
|
|