Establishing an Optimized Caco-2/THP-1 Co-Culture Model to Efficiently Simulate Inflammatory Bowel Disease In Vitro
-
Parsamanesh , Gilda
-
Department of Immunology, School of Medicine, Tehran University of Medical Sciences, Tehran, Iran
-
Gastroenterology and Liver Diseases Research Center, Research Institute for Gastroenterology and Liver Diseases, Shahid Beheshti University of Medical Sciences, Tehran, Iran
-
Baghaei, Kaveh
-
Gastroenterology and Liver Diseases Research Center, Research Institute for Gastroenterology and Liver Diseases, Shahid Beheshti University of Medical Sciences, Tehran, Iran
-
Olivia Newton-John cancer Research Institute and School of cancer Medicine, La Trobe University, Heidelberg VIC, Australia
-
 Rezaei, Nima
Department of Immunology, School of Medicine, Tehran University of Medical Sciences, Tehran, Iran, Tel: +98 21 66929234; E-mail: rezaei_nima@tums.ac.ir
Rezaei, Nima
Department of Immunology, School of Medicine, Tehran University of Medical Sciences, Tehran, Iran, Tel: +98 21 66929234; E-mail: rezaei_nima@tums.ac.ir
-
Research Center for Immunodeficiencies, Children’s Medical Center Hospital, Tehran University of Medical Sciences, Tehran, Iran
-
Network of Immunity in Infection, Malignancy and Autoimmunity (NIIMA), Universal Scientific Education and Research Network (USERN), Tehran, Iran
Abstract: Background: Inflammatory Bowel Disease (IBD) is a complex disorder for which the mechanisms and targeted therapies remain unclear. Several in vitro models, including organoids, cytokine-stimulated Caco-2 monolayers, and co-culture systems, have been developed to study IBD pathogenesis and potential treatments. Meanwhile, the Caco-2/THP-1 co-culture is a practical model representing the interaction of intestinal epithelial and immune cells. However, multiple factors, such as culture duration and exposure time to inflammatory agents, significantly affect model outcomes. Developing an optimized co-culture that better mimics intestinal inflammation can introduce a valuable method for future studies. This study aimed to optimize a Caco-2/THP-1 co-culture model, focusing on culture timing and treatment conditions.
Methods: THP-1 monocytes were differentiated into macrophage-like cells (M0) with phorbol 12-myristate 13-acetate (PMA, 50 ng/ml, 48 hr). M0 cells were treated with different Lipopolysaccharide (LPS) concentrations for 6 or 24 hr to determine the optimal inflammatory dose. Inflammatory macrophages (M1) were co-cultured with differentiated or undifferentiated Caco-2 monolayers. Expression of IL-6, IL-8, and TNF-α was measured by qRT-PCR, M1 macrophage markers (CD86/HLA-DR) by flow cytometry, and nitric oxide by the Griess assay.
Results: Stimulation with 100 ng/ml LPS for 6 hr increased M1 (CD86⁺/HLA-DR⁺) macrophages to 58.9% and induced maximal nitric oxide production (179.3 µM).
Co-culture with these M1 cells enhanced IL-8 and modestly increased IL-6 expression in differentiated Caco-2 cells compared with other groups.
Conclusion: The differentiated Caco-2/THP-1 co-culture efficiently mimics intestinal inflammation observed in IBD and provides an optimized in vitro model for further investigations.
Introduction :
Inflammatory Bowel Disease (IBD) is a multifactorial, immune-mediated disorder that disrupts the structure and function of the intestine 1. The two main clinical manifestations of IBD are Crohn’s disease and ulcerative colitis. The incidence of IBD has increased globally in recent decades, posing a growing healthcare and socioeconomic burden 2. Although its exact etiology remains unclear, genetic susceptibility, gut microbiota imbalance, and environmental triggers are known to contribute to disease development 3,4. Disruption of epithelial tight junctions and dysregulated of immune cell activation lead to increased recognition of self-antigens and microbiota-derived 5. Consequently, the adaptive immune response, particularly T lymphocytes, causes damage to intestinal epithelial cells and promotes inflammation 6. Persistent inflammation in the intestinal mucosa leads to further epithelial damage, cytokine overproduction, and infiltration of immune cells, resulting in impaired mucosal healing 7,8. Therefore, understanding the mechanisms underlying intestinal inflammation and immune–epithelial interactions is essential for developing effective therapeutic strategies.
Evaluation of intestinal inflammation mechanisms in patients is restricted by ethical considerations and limited access to intestinal tissues 9. Although animal models established to mimic IBD pathogenesis are valuable tools, they do not fully reflect the human disease. Chemically induced models using Dextran Sodium Sulfate (DSS) and Trinitrobenzene Sulfonic Acid (TNBS) fail to mimic the complexity and multifactorial nature of human IBD and often cause systemic effects 10-12. The interleukin-10 knockout (IL-10 KO) mouse is a genetically engineered model for human Crohn's disease; however, it represents a single disease phenotype, and its high cost, coupled with limited reproducibility, is an additional limitation for mechanistic or drug-screening studies 13-15.
Therefore, cell-based in vitro models remain valuable tools for investigating intestinal inflammation and dysfunction. Furthermore, specific variables such as cytokine exposure, immune-cell activation, and epithelial barrier function can be controlled by a simplified, yet reliable, in vitro system 16.
Over the years, various in vitro models have been introduced to explore intestinal inflammation and barrier dysfunction. Monolayer cultures of epithelial cell lines such as Caco-2 and HT-29, or more advanced approaches including organoids, are widely used to assess epithelial integrity and cytokine release in response to inflammatory stimuli 1,9,17. However, these models lack the immune interactions that play a critical role in IBD pathogenesis. For this purpose, co-culture systems have been introduced to study the interaction between epithelial and immune cells. The Caco-2/THP-1 co-culture model is efficient because it represents the crosstalk between intestinal epithelial and monocyte-derived macrophages 18. This model allows the assessment of the effects of immune-cell components, such as cytokines, on epithelial cells. Nevertheless, differences in cell differentiation stages and Lipopolysaccharide (LPS) dosing have led to contradictory results 19. Therefore, optimizing these parameters is essential for establishing a reliable and standardized in vitro model of IBD. The present study was designed to investigate the optimal stimulation time and LPS concentration for inflammatory macrophage differentiation, as well as its impact on epithelial inflammatory responses under different culture conditions. We hypothesized that the co-culture of differentiated intestinal epithelial cells (Caco-2) with activated macrophages (M1), compared to monolayer and undifferentiated models, would generate a more representative inflammatory environment for future IBD studies.
Materials and Methods :
Cell culture and maintenance
Human THP-1 monocytes and Caco-2 epithelial cells were obtained from the National Cell Bank of Pasteur Institute of Iran (NCBI, Tehran, Iran). THP-1 cells were cultured in RPMI-1640 medium (Biosera, France), and Caco-2 cells were maintained in Dulbecco’s Modified Eagle’s Medium (DMEM; Biosera, France). Both media were supplemented with 10% fetal bovine serum (FBS; Gibco, USA), 1% penicillin–streptomycin (Gibco, USA), and 1% L-glutamine (Gibco, USA). Cells were incubated at 37°C in a humidified atmosphere containing 5% CO₂.
Differentiation of THP-1 monocytes into macrophages (M0) and polarization into M1: THP-1 cells were seeded at 2.5×10⁵ cells in a 12-well plate in RPMI-1640 medium and treated with 50 ng/ml phorbol 12-myristate 13-acetate (PMA; Santa Cruz Biotechnology, USA) for 48 hr to induce differentiation into macrophage-like cells (M0). The cells were then washed twice with phosphate-buffered saline (PBS; Biosera, France) and incubated in fresh complete medium for 24 hr to allow recovery.
For M1 polarization, M0 macrophages were stimulated with different concentrations of lipopolysaccharide (LPS; Sigma-Aldrich, USA) for 6-hr and 24-hr groups to evaluate the optimal inflammatory response. Inflammatory activation and successful M1 polarization were assessed by measuring IL-6, IL-8, and TNF-α gene expression (qRT-PCR), CD86 and HLA-DR surface markers (flow cytometry), and nitric oxide production (Griess assay).
Culture and differentiation of Caco-2 cells: Caco-2 epithelial cells were cultured under the conditions described above. For the undifferentiated condition, 5×10⁵ cells were seeded in a 6-well plate and used 24 hr after seeding. For long-term differentiation, Caco-2 cells were seeded at a lower density (1.5×10⁵ cells) to prevent over-confluence and maintained for 14 days. The culture medium was replaced every 2-3 days. After 14 days, cells reached full confluence and were considered morphologically differentiated.
Co-culture setup and inflammatory stimulation: For the establishment of the in vitro epithelial barrier model, Caco-2 cells were seeded onto the apical side of Transwell inserts with a 0.4 μm pore size (SPL Life Sciences, South Korea). For the differentiated condition, Caco-2 cells were cultured on the inserts for 14 days until reaching full confluence and morphological differentiation. For the fresh (undifferentiated) condition, Caco-2 cells were seeded one day one day prior to co-culture.
THP-1 monocytes were differentiated into macrophage-like cells (M0) using PMA (50 ng/ml, 48 hr) and subsequently polarized to M1 macrophages by stimulation with LPS (100 ng/ml, 6 hr). The differentiated M1 macrophages were placed in the basolateral chamber of the Transwell system at a 1:2 ratio of Caco-2 cells to THP-1 cells. This indirect co-culture setup allowed soluble-factor exchange between epithelial and immune compartments without direct cell contact.
For induction of inflammation, LPS was applied only to the macrophage (basolateral) compartment under the optimized condition (100 ng/ml for 6 hr), and afterward, the Caco-2 cells were collected to assess epithelial inflammatory responses.
Gene expression analysis by qRT-PCR: Total RNA was extracted from cells using the RNA extraction kit (ROJE Technologies, Iran) according to the manufacturer’s protocol. The RNA concentration and purity were assessed spectrophotometrically (the A260/A280 ratio). Complementary DNA (cDNA) was synthesized from 1 µg of total RNA using the Pars Tous cDNA synthesis kit (Pars Tous, Iran). Quantitative real-time PCR was performed using SYBR Green Master Mix (APPLICONE, Germany) on a real-time PCR system. Relative gene expression levels of IL-6, IL-8, and TNF-α were calculated using the 2⁻ΔΔCt method after normalization to GAPDH expression and reported as log₂-relative expression or relative expression.
Nitric Oxide (NO) measurement: NO production was quantified in culture supernatants using a commercial Griess reagent kit (Cib Biotech, Iran) according to the manufacturer’s instructions. Absorbance was measured at 540 nm using an ELISA microplate reader (BioTek Epoch, USA). The concentration of nitrite was calculated using a sodium-nitrite standard curve.
Flow cytometry analysis: To confirm macrophage polarization, THP-1-derived macrophages were stained with anti–HLA-DR-FITC and anti–CD86-PE (eBioscience, USA). After staining, cells were analyzed using a BD FACSCalibur flow cytometer (BD Biosciences, USA), and data were processed with FlowJo software (Tree Star Inc., USA). The percentage of positive cells was used to assess macrophage activation.
Statistical analysis: All experiments were performed in at least three independent biological replicates. Data are presented as the mean±standard error of the mean (SEM). Statistical analysis was conducted using GraphPad Prism version 10.5.0 (GraphPad Software, USA). Differences among groups were analyzed by one-way ANOVA followed by Tukey’s multiple comparison test. The p<0.05 (*), <0.01 (**), <0.001 (***), and <0.0001 (****) were considered statistically significant at all levels. All graphs and statistical plots were prepared using GraphPad Prism.
Results :
100 ng/ml LPS for 6 hr induces optimum upregulation of pro-inflammatory cytokines: To identify the optimal conditions for M1 polarization, THP-1–derived macrophages (M0) were stimulated with different concentrations of LPS (20, 100, or 1000 ng/ml) for 6 or 24 hr. Three LPS doses were chosen based on standard THP-1 literature and to establish a low–medium–high optimization pattern. The relative log₂ expression of key pro-inflammatory cytokine genes (IL-6, IL-8, and TNF-α) was quantified by qRT-PCR.
After 6 hr of stimulation, LPS induced a significant upregulation of all three cytokines. IL-6 expression showed a clear dose-dependent increase, rising from a baseline of 0.58±0.055 in untreated cells to 6.82±0.54, 7.78±0.046, and 7.09±0.18 following exposure to 20, 100, and 1000 ng/ml LPS, respectively (Figure 1A). A similar trend was observed for TNF-α expression, which peaked at 8.06±0.63 with 1000 ng/ml LPS (Figure 1B). IL-8 expression also increased significantly, reaching its maximum level at 100 ng/ml LPS (7.95±0.60, p<0.0001) (Figure 1C).
At the 24-hr time point, cytokine expression remained elevated relative to the control group, but the difference between the 100 ng/ml and 1000 ng/ml groups was less pronounced (Figures 2A, 2B, and 2C). These data indicates that the peak transcriptional response occurred within the first 6 hr. These findings identify 100 ng/ml LPS for 6 hr as the most effective condition for inducing a robust log₂ upregulation of pro-inflammatory genes.
NO production peaks at 6 hr with 100 ng/ml LPS: To functionally assess macrophage activation, NO production was quantified in culture supernatants. At 6 hr, nitric oxide levels increased from 3.01±0.20 µM in controls to 179.3±11.78 µM after stimulation with 100 ng/ml LPS (p<0.0001) (Figure 3A). An intermediate increase was observed with 20 ng/ml LPS (69.08± 21.13 µM), whereas the 1000 ng/ml concentration failed to enhance NO release (2.43±0.21 µM).
By 24 hr, NO concentrations in all LPS-treated groups had returned to levels comparable to the control (ranging from 2.31 to 3.82 µM), indicating that NO synthesis is a transient response to LPS stimulation (Figure 3B). These findings are consistent with the gene expression results, confirming that a 6-hr stimulation with 100 ng/ml LPS induces the strongest functional activation in THP-1–derived macrophages.
Flow cytometry analysis confirms M1 macrophage polarization: To validate M1 polarization, the expression of surface markers CD86 and HLA-DR, as the main M1 characteristics, was quantified by flow cytometry. Cells were stimulated with an optimal concentration of 100 ng/ml LPS and analyzed at 6 and 24 hr.
After 6 hr, LPS stimulation, the proportion of M1 marker–positive cells were 58.9±9.9% compared to the unstimulated M0 control (28.5±3.6%) (Figure 4). This difference was maintained at 24 hr, with stimulated cells showing 35.7±11.0% positivity versus 17.1±0.8% in controls (Figure 5). A direct comparison between the two time points revealed that 6-hr stimulation induced a more robust M1 response than the 24-hr exposure (58.9 vs. 35.7%) (Figure 6).
These results are consistent with the transcriptional data, confirming that a 6-hour stimulation with 100 ng/ml LPS is the most potent condition for driving THP-1–derived macrophages toward the pro-inflammatory M1 phenotype. Differentiated Caco-2 cells co-cultured with M1 macrophages activated by 6 hr of LPS stimulation display a stronger inflammatory response.
To assess the functional effect of macrophage polarization on epithelial inflammation, a co-culture system was established. THP-1–derived M1 macrophages (stimulated with 100 ng/ml LPS for 6 hr) were co-cultured with Caco-2 cells cultured for 24 hr (undifferentiated; fresh Co-culture) and with differentiated Caco-2 cells. Both Caco-2 populations were treated with 100 ng/ml LPS in different groups to evaluate the potential of M1 macrophages to induce inflammatory conditions. qRT-PCR analysis quantified the expression of key inflammatory markers in Caco-2 cells relative to unstimulated controls (Figure 7). The control group consisted of unstimulated Caco-2 cells cultured without LPS treatment or macrophage co-culture. For THP-1, the control condition included PMA-differentiated M0 macrophages that were not exposed to LPS.
Co-culture with M1 macrophages resulted in marked upregulation of pro-inflammatory genes. IL-8 expression increased by approximately 3.94±0.41-fold (p<0.0001), while direct LPS treatment of differentiated Caco-2 cells induced a smaller increase of 2.17±0.217 log₂ units (p<0.05) (Figure 7A). Similarly, IL-6 expression rose by roughly 1.8 log₂ units in both differentiated and undifferentiated Caco-2 cells exposed to M1 macrophages (1.82±0.14 and 1.79±0.08, p<0.001) (Figure 7B). In contrast, direct LPS treatment did not significantly alter IL-6 expression compared with controls.
In Caco-2 epithelial cells, TNF-α expression was downregulated upon LPS stimulation; however, co-culture with M1 macrophages partially mitigated this reduction (Figure 7C). These results indicate that M1-polarized macrophages create a more physiologically relevant pro-inflammatory microenvironment by releasing soluble factors that actively induce inflammatory responses in the co-cultured Caco-2 cells.
Discussion :
In our study, different cell differentiation and stimulation conditions were compared, and an optimized Caco-2/THP-1 co-culture model was introduced to mimic intestinal inflammation. The results indicate that M1 macrophages stimulated for 6 hr with LPS generated the strongest inflammatory response at the gene level 20,21. Subsequently, co-culture of M1 cells with 14-day differentiated Caco-2 cells lead to a significant increase in IL-6 and IL-8 gene expression 18,22,23. In contrast, models with other inflammation stimuli or undifferentiated epithelial cells showed a weaker response. Surprisingly, it was also observed that TNF-α may not be a reliable indicator for examining the inflammatory response in Caco-2 cells, as its expression was reduced in most conditions. Therefore, this study does not establish a new model but rather provides an optimized and reproducible model for investigating epithelial inflammation. In addition, this optimized model may facilitate standardization and enable more accurate comparison of future studies in the field of IBD.
The increased expression of IL-6 and IL-8 in the co-culture model indicates the activation of classical inflammatory pathways in intestinal epithelial cells 18,24. These cytokines are key factors in the innate immune response, which are induced by macrophage signals through the NF-κB and MAPK pathways 25,26. In the co-culture model, M1 macrophages that were activated with LPS for a short time (6 hr) caused a significant increase in the expression of IL-6 and IL-8 in Caco-2 cells by secreting factors such as TNF-α and IL-1β in a paracrine manner 27,28. This explains why the inflammatory response in the co-culture model was stronger than in the Caco-2 monolayer model. On the other hand, in many studies, Caco-2 cells are stimulated with different inflammatory components such as LPS and IFN-γ to induce inflammatory conditions 29,30. However, our results and similar studies have shown that this approach alone does not always induce a significant inflammatory response, because Caco-2 lacks complete innate immune recognition and response pathways 31. In the present study, although direct treatment with LPS resulted in a slight increase in the gene expression of IL-8, this increase was much less than the response observed in the co-culture model. Therefore, the presence of immune cells such as macrophages is essential for effective induction of inflammation in vitro.
The rapid increase in NO production after 6 hr of LPS stimulation indicates the early activation phase of macrophages. This transient rise in NO likely reflects the short-term activity of inducible Nitric Oxide Synthase (iNOS). Prolonged stimulation or higher doses of LPS, however, are known to cause metabolic exhaustion and endotoxin tolerance, leading to reduced NO output at later time points 32,33.
Furthermore, the difference in response between differentiated and undifferentiated Caco-2 cells is also notable. Differentiated cells have more extracellular structures and surface receptors, which makes them more sensitive to inflammatory stimuli 34,35. In contrast, freshly cultured cells usually show a weaker inflammatory response due to the instability of membrane integrity and incomplete maturation of signaling pathways 35,36. This difference could be one of the main reasons for the inconsistency in results between different studies.
The present model was able to generate a clear and reproducible inflammatory response, but it also has limitations. The system only includes two cell types and cannot reflect the complex in vivo interactions or the role of the microbiome. In addition, the assessments were performed at the mRNA level, and protein-based examination of the pathways could provide further validity to the results in the future. However, the main strength of the study is the design of a simple, optimized, and reproducible model to investigate the interaction between epithelial cells and immune cells in intestinal inflammation.
Conclusion :
The results of this study showed that the Caco-2/THP-1 co-culture model with 6-hour stimulation of M1 macrophages and the use of differentiated Caco-2 cells induces the most effective and reproducible inflammatory response in vitro. This optimal model simulates the interaction between epithelial and immune cells and induces stronger cytokine responses compared to monolayer models or longer stimulations periods.
The use of differentiated cells seems to play a key role in the stability of the inflammatory response and could be one of the main reasons for the differences in results across different studies. Accordingly, the present model can be used as a standard and reproducible system to investigate the mechanisms of intestinal inflammation and screen anti-inflammatory or probiotic compounds. In addition, extending this model to 3D or organoid systems could lead to a better understanding of more complex cellular and physiological interactions.
Acknowledgement :
This study was supported by the project grant No. 91204. The authors also acknowledge that all experimental procedures were approved by the Ethics Committee of Tehran University of Medical Sciences (Ethics code: IR.TUMS.CHMC.REC.1401.125).
Conflict of Interest :
The authors declare no conflict of interest.
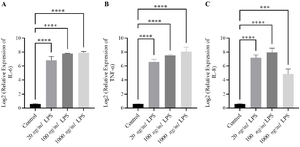
Figure 1. Induction of pro-inflammatory cytokines in THP-1–derived macrophages after 6-hr LPS stimulation. THP-1–derived macrophages were treated with different concentrations of LPS (20, 100, and 1000 ng/mL) for 6 hr, and mRNA expression of IL-6, TNF-α, and IL-8 was determined by qRT-PCR. LPS stimulation significantly upregulated IL-6, TNF-α, and IL-8 (p<0.0001) compared with unstimulated control cells. (A) IL-6 and (B) TNF-α expression showed a dose-dependent elevation across all concentrations. While the strongest increase in (C) IL-8 expression was observed at 100 ng/ml (p<0.0001). These findings indicate that short-term exposure to 100 ng/ml LPS induces a robust transcriptional activation of pro-inflammatory genes in macrophages. Data are presented as mean log₂-relative expression±SEM of three independent experiments. Statistical significance was assessed using one-way ANOVA followed by Tukey’s post hoc test.
|
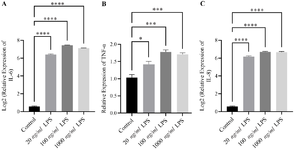
Figure 2. Prolonged (24-hr) LPS stimulation maintains cytokine expression in THP-1–derived macrophages. THP-1–derived macrophages were stimulated with LPS (20, 100, and 1000 ng/ml) for 24 hr to evaluate the temporal dynamics of cytokine expression. After 24 hr, (A) IL-6 and (C) IL-8 expression levels remained significantly higher than in unstimulated controls (p<0.0001), whereas (B) TNF-α expression also stayed elevated but without further enhancement compared to the 6-hr response (p<0.01 and p<0.001). Data are presented as mean log₂-relative expression±SEM and mean relative expression±SEM (TNF-α) of three independent experiments. Statistical significance was determined using one-way ANOVA followed by Tukey’s post hoc test.
|
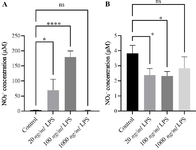
Figure 3. Nitric oxide (NO) production in THP-1–derived macrophages following LPS stimulation. THP-1–derived macrophages were stimulated with increasing concentrations of LPS (20, 100, and 1000 ng/ml) for 6 hr (A) and 24 hr (B). Nitric oxide production was quantified in the culture supernatants using the Griess assay. After 6 hr of stimulation (A), NO levels markedly increased in LPS-treated macrophages compared with unstimulated controls. The 100 ng/ml LPS treatment induced the highest NO release, reaching approximately 179 µM (p<0.0001), whereas 1000 ng/ml failed to further enhance production. By 24 hr (B), NO concentrations in all LPS-treated groups had returned to levels even lower than control levels indicating that NO synthesis is an early and transient response to LPS stimulation. Data are presented as mean±SEM of three independent experiments. Statistical significance was determined using one-way ANOVA followed by Tukey’s post hoc test.
|
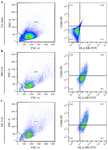
Figure 4. Flow cytometric analysis of M1 marker expression in THP-1–derived macrophages after 6-hr LPS stimulation. (A) Gating strategy for identification of CD86⁺/HLA-DR⁺ macrophages. Quadrant boundaries were set according to unstained controls. (B) Representative dot plots show 28.5±3.6% CD86⁺/HLA-DR⁺ cells in macrophage-like cells (M0) differentiated with PMA (50 ng/ml, 48 hr). An apparent increase in CD86⁺/HLA-DR⁺ cells was observed following 100 ng/ml LPS stimulation, indicating macrophage activation toward the M1 phenotype. (C) The proportion of CD86⁺/HLA-DR⁺ cells reached 58.9±9.9% after 6 hr of stimulation.
|
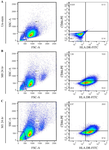
Figure 5. Flow cytometric analysis of M1 marker expression in THP-1–derived macrophages after 24-hr LPS stimulation. (A) Gating strategy for identification of CD86⁺/HLA-DR⁺ macrophages. Quadrant boundaries were set according to unstained controls. (B) Representative dot plots show 17.1±0.8% CD86⁺/HLA-DR⁺ cells in macrophage-like cells (M0) differentiated with PMA (50 ng/ml, 48 hr). Following 100 ng/ml LPS stimulation for 24 hr, the proportion of double-positive cells increased to 35.7±11.0%, indicating that macrophage activation was maintained over time, though at a lower level than the 6-hr stimulation.
|
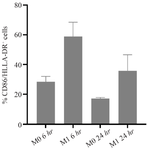
Figure 6. Comparative analysis of M1 marker expression in THP-1–derived macrophages after 6- and 24-hr LPS stimulation. Flow cytometric quantification of CD86⁺/HLA-DR⁺ macrophages following stimulation with 100 ng/ml LPS for 6 hr and 24 hr. The proportion of double-positive cells peaked at 58.9±9.9% after 6 hr and remained elevated at 35.7±11.0% after 24 hr, compared with 28.5±3.6% in unstimulated M0 controls. These data indicate that early (6-hr) LPS exposure induces the most pronounced macrophage activation, while a sustained but attenuated activation persists after 24 hr.
|
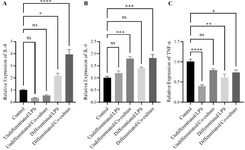
Figure 7. Inflammatory gene expression in differentiated and undifferentiated Caco-2 cells co-cultured with M1 macrophages. Differentiated (14-day) and undifferentiated (24-hr) Caco-2 cells were co-cultured with THP-1–derived M1 macrophages activated by 100 ng/ml LPS for 6 hr or treated directly with LPS. mRNA expression levels of IL-6, IL-8, and TNF-α were quantified by qRT-PCR and normalized to GAPDH. Co-culture with M1 macrophages markedly increased (A) IL-8 (≈3.94±0.41-fold, p<0.0001) and (B) IL-6 (≈1.8-fold, p<0.001) compared with LPS-treated or unstimulated controls. Direct LPS exposure induced only a modest IL-8 increase and had minimal effect on IL-6. (C) TNF-α expression was downregulated upon LPS treatment but partially restored in the M1 co-culture condition. Data are expressed as mean±SEM of three independent experiments. Statistical significance was assessed using one-way ANOVA followed by Tukey’s post hoc test. The control group for Caco-2 consisted of unstimulated epithelial cells without LPS treatment or macrophage co-culture. For THP-1, M0 macrophages (PMA-differentiated non-stimulated) served as the control condition.
|
|