Investigation of the Molecular Signature of Senescence in Mesenchymal Stem Cells
-
Sayahpour , Forough-Azam
-
Medical College of Wisconsin, Center of Cancer Discovery, Milwaukee, Milwaukee, Wisconsin, United States of America
-
Nejati, Marjan
-
Department of Stem Cells and Developmental Biology, Cell Science Research Center, Royan Institute for Stem Cell Biolo-gy and Technology, ACECR, Tehran, Iran
-
Department of Cell and Molecular Biology, School of Biology, College of Sciences, University of Tehran, Tehran, Iran
-
Rouhollahi-Masoumi , Mahya
-
Department of Stem Cells and Developmental Biology, Cell Science Research Center, Royan Institute for Stem Cell Biolo-gy and Technology, ACECR, Tehran, Iran
-
 Baghaban Eslaminejad, Mohammadreza
Department of Stem Cells and Developmental Biology, Cell Science Research Center, Royan Institute for Stem Cell Biology and Technology, ACECR, Tehran, Iran, Tel: +98 21 22338950, 23562000; E-mail: eslami@royaninstitute.org
Baghaban Eslaminejad, Mohammadreza
Department of Stem Cells and Developmental Biology, Cell Science Research Center, Royan Institute for Stem Cell Biology and Technology, ACECR, Tehran, Iran, Tel: +98 21 22338950, 23562000; E-mail: eslami@royaninstitute.org
-
Taleahmad, Sara
Department of Stem Cells and Developmental Biology, Cell Science Research Center, Royan Institute for Stem Cell Biology and Technology, ACECR, Tehran, Iran, Tel: +98 21 22338950, 23562000; E-mail: s.taleahmad@royan-rc.ac.ir
Abstract: Background: Mesenchymal Stem Cells (MSCs) play a pivotal role in regenerative medicine due to their multipotency and immunomodulatory properties. However, during in vitro expansion, MSCs undergo senescence, characterized by a decline in proliferation, impairment of differentiation potential, and altered secretory profiles, which limits their therapeutic efficacy. This study aimed to identify novel molecular regulators and net-work-level interactions underlying MSC senescence through microarray analysis of the GSE7888 dataset, comparing early and senescent MSCs.
Methods: A total of 4597 Differentially Expressed Genes (DEGs) were identified be-tween early (passages 4-5) and senescent (passages 22-28) MSCs, with 2219 upregulated and 2379 downregulated. Key regulators such as CDKN1A (p21), CDK4, and CDK6 were implicated in cell cycle arrest and the progression of senescence. Pathway analysis highlighted the mTOR, FoxO, and p53 signaling pathways as key regulators of stress responses, metabolism, and aging. Gene Ontology (GO) enrichment and Kyoto Encyclopedia of Genes and Genomes (KEGG) pathway analysis highlighted cellular processes, including protein transport and intracellular signaling, while protein-protein interaction networks identified high-connectivity nodes such as TP53, FOXO3, and MDM2. Senescent MSCs displayed phenotypic changes, including altered morphology and the emergence of the Senescence-Associated Secretory Phenotype (SASP), which impaired re-generative potential.
Results: The findings suggest that targeting the mTOR, FoxO, and p53 pathways could delay senescence and enhance MSC therapeutic potential. Interventions such as rapamycin and FoxO3 activators show promise in reversing senescence.
Conclusion: Future research should explore small molecules and gene-based therapies targeting senescence pathways to improve MSC-based regenerative strategies. These results provide a foundation for developing innovative approaches to optimize MSC ap-plications in clinical therapies.
Introduction :
Mesenchymal Stem Cells (MSCs) have a high potential for regenerative medicine because they can renew themselves and transform into different cell types. As MSCs undergo multiple cell divisions, they enter a senescent state, reducing their proliferation, differentiation, and therapeutic potential 1. It is essential to identify the genes and pathways that control senescence in MSCs to optimize their effectiveness in cell-based treatments. Cell therapy, an emerging field in regenerative medicine, has shown significant potential to transform the treatment of various diseases by harnessing
the body’s cells for therapeutic purposes 2. MSCs are a leading cell type among the several cells under research due to their unique properties. MSCs are capable of differentiating into a wide variety of cell types and are self-renewing 3. Their multipotency may allow them to aid in tissue regeneration and healing. Furthermore, due to their immunomodulatory abilities, which allow them to decrease the immune system's responses, MSCs have the potential to treat inflammatory diseases 4. Due to their potential for better clinical results in a range of diseases, these characteristics emphasize the significance of studying MSC-based therapeutics.
One of the major challenges in cell therapy and regenerative medicine is MSC senescence during in vitro expansion. Senescent MSCs exhibit reduced proliferation, impaired differentiation, and altered secretory profiles, limiting their clinical efficacy 5,6. Cellular senescence is when cells cease dividing permanently. This process serves as a protection against unchecked cell proliferation, thereby halting cancer formation 7,8. Nevertheless, the mechanisms that prevent cancer can also play a role in causing tissue dysfunction and aging 9. Gaining insight into the molecular mechanisms that play a role in cellular senescence presents promising opportunities for developing treatments for age-related illnesses and cancer 10. Currently, utilizing senescent MSCs in cell-based therapies presents significant challenges. Senescent cells can secrete a pro-inflammatory Senescence-Associated Secretory Phenotype (SASP) that can impair tissue repair and potentially promote tumorigenesis 11. Additionally, aging MSCs show reduced abilities to regulate the immune system and regenerate tissues 12. The genes and pathways identified could be potential targets for future studies focused on regulating senescence in MSCs. Possible approaches could involve using senolytics, a group of medications created to remove senescent cells, or controlling upstream signal pathways to postpone or reverse senescence 13,14. Furthermore, potential ways to lessen the harmful impacts of SASP, such as investigating the use of SASP modulators, could be analyzed 15.
This research thoroughly investigates the gene expression profiles linked to cellular senescence in MSCs. Microarray analysis was used to discover genes that show different expression levels in young, healthy MSCs compared to their senescent counterparts. To guarantee the dependability and applicability of the results, a top-notch dataset (GSE7888) was carefully chosen from the Gene Expression Omnibus (GEO) database 16. Cellular reprogramming techniques have advanced recently, giving some hope. By controlling the expression of certain transcription factors, there is a chance to rejuvenate aging MSCs and enhance their therapeutic effectiveness 17.
Integrating strategies based on large datasets shows great potential. Researchers can have a more thorough understanding of cellular senescence in MSCs by combining data from transcriptomics, proteomics, and metabolomics data from different sources 18. This multi-omics approach can lead to the creation of customized treatment plans designed to target the unique aging characteristics of each patient's MSCs.
While the potential benefits of this research are substantial, ethical considerations must be addressed. Manipulating cellular senescence has the potential for unintended consequences. For instance, eliminating senescent cells could disrupt tissue homeostasis and wound healing 19. Additionally, cellular reprogramming techniques require careful evaluation to ensure they do not inadvertently promote tumorigenesis or disrupt tissue homeostasis 20.
Materials and Methods :
Data collection and processing: This study employed the Gene Expression Omnibus (GEO) database (https://www.ncbi.nlm.nih.gov/geo) using the keywords "Cell senescence" and "Senescence of MSCs" to identify potential microarray datasets. The raw microarray data were preprocessed using quantile normalization to ensure uniform distribution across samples. Data quality was evaluated through boxplots and Principal Component Analysis (PCA). Batch effects were assessed and corrected using the remove Batch Effect function from the Limma package.
Identification of Differentially Expressed Genes (DEGs): In this study, the GSE7888 dataset included 24 samples obtained from hMSCs. The samples were divided into two groups: early stage (passages 4-5), and senescing stage (passages 22-28). Microarray data from the GSE7888 dataset were analyzed using R version 4.0.1, with PCA performed to assess data quality. The microarray data were analyzed using the Limma package for linear modeling to identify DEGs in response to senescence and maturation. The thresholds of adjusted p-value <0.05 and |log2FC| ≥1 were selected according to commonly accepted standards.
Cluster heatmap and volcano plot: To visualize the correlation matrix of different samples, a clustered heatmap was generated on the normalized and log-transformed expression data using the pheatmap R package. Additionally, volcano plots were employed as a visualization tool to discern the significant differences among various DEGs, employing criteria such as adjusted p-value <0.05 21 and the magnitude of log2 fold change (Log2 FC) 22. Volcano plots were generated using the ggplot2 package in R.
GO and functional enrichment analysis Subsequently, these sets of DEGs were subjected to analysis using the Database for Annotation, Visualization, and Integrated Discovery (DAVID) (https://david. ncifcrf.gov/) for gene annotation. GO analysis was conducted for up- and down-regulated DEGs separately to identify the Biological Process (BP), Cellular Component (CC), and Molecular Function (MF). Additionally, the Kyoto Encyclopedia of Genes and Genomes (KEGG) database was explored to discern signaling pathways associated with the DEGs. Functional enrichment and KEGG analysis were conducted for each dataset and time frame.
Construction of the Protein-Protein Interaction (PPI) network: To create the PPI network, the NetworkAnalyst v3 database, which integrates data from the STRING database (https://string-db.org/) was utilized. Filtration was done for interactions with a confidence score ≥0.9 to ensure high reliability of the predicted protein interactions. The resulting PPI network was visualized, and the key nodes (genes) were identified and prioritized based on two main criteria: node degree (the number of connections a node has) and the log FC of the gene expression. Genes with high connectivity and significant expression change were considered key regulators in cell senescence.
Results :
Identification of key genes and signaling pathways in MSC senescence: To investigate differential gene expression profiles under cell senescence, initially the microarray data of the GSE7888 dataset was obtained and normalized. Data sampling quality was assessed using PCA (Figure S1A) and clustered heatmap analysis (Figure S1B). Volcano plots (Figure S1C) were generated to identify DEGs with significant changes between early (passages 4-5) and senescent (passages 22-28) MSCs. A total of 4,597 DEGs met the screening criteria (adj. p<0.05 and ∣logFC∣>1), with 2,219 genes upregulated and 2,379 genes downregulated.
To elucidate the molecular mechanisms underlying cell senescence, GO and KEGG pathway analysis were performed, focusing on alterations in gene expression between early and late passages. Biological Process (BP) analysis using the DAVID tool identified key genes, including CDKN1A, PTEN, CCND2, CCND1, BTRC, FBXW11, TP53, FOXO3, SMAD2, CDKN2B, CDKN2A, HIPK2, CDK6, CDK4, and MDM2. These genes were significantly enriched in pathways associated with cellular senescence, FoxO signaling, mTOR signaling, calcium signaling, and the spliceosome complex, highlighting their involvement in key regulatory processes of aging.
CC and MF analyses revealed that up-regulated genes were predominantly localized to the nucleoplasm, cytosol, golgi membrane, Endoplasmic Reticulum (ER), and extracellular exosomes, indicating increased organelle abundance and cellular maturation during senescence. In contrast, down-regulated genes were associated with the nucleoplasm, cytosol, ribonucleoprotein complex, spliceosomal complex, and chromatin, reflecting functional declines in cell adhesion, apoptosis, and endocytosis pathways (Figure 1A).
These findings provide evidence of dual processes during senescence: enhanced cellular maturation characterized by organelle biogenesis and simultaneous functional impairments in cell adhesion and apoptotic regulation. Collectively, this analysis offers insights into the complex regulatory networks driving cellular aging (Figure 1B).
Integrated analysis of PPI, transcription factor, and protein kinase networks: PPI Hubs and Core Regulators: The PPI network analysis identified several high-connectivity hub nodes critical to the senescence process (Figure 2E). Prominent among these core regulators were TP53, FOXO3, and MDM2, which were identified by their strong connectivity in aging-related pathways. Highly connected proteins, such as RPLP1, RPL13A, and RPS23, also indicated major hubs in the senescence-related signaling pathways.
Transcription factors and kinases: Transcription factors with the highest connectivity (Figure 2A) showed significant involvement in senescence-related processes. Among them, SPI1, YY1, and SP1 emerge as major regulatory nodes (Figure 2B), indicating their influence in modulating gene expression networks. The most significant kinases, such as CDK2, CDK4, and CDK6, are well-established regulators of the cell cycle (Figure 2C). The extensive interactions of these kinases suggest they modulate key proteins responsible for growth inhibition and senescence induction, underscoring their potential as therapeutic targets. The unified PPI-TF-PK network (Figure 2E) integrates all molecular interactions, capturing the complexity of cellular senescence regulation.
GO chord analysis of senescence-related genes: GO chord analysis was performed to visually depict the relationship between key DEGs and their enriched pathways after cell passages. The results showed that the most common genes in BPs are related to protein transport, ER to Golgi vesicle-mediated transport, and intracellular protein transport. The results of KEGG pathways showed the most important genes, which confirms the previous results. Then, a chord diagram was drawn to visually show the inter-relationships and weight relationships between key genes and selected KEGG pathways. Among these pathways, 12 important genes, characterized by the highest log FC and the lowest adjusted p-values, were highlighted and nominated for their association with these pathways (Figure 3).
Discussion :
This study provides novel insights compared with previous analyses using the GSE7888 dataset. An integrative analysis combining PPI, TF, and protein kinase networks was performed to identify key molecular hubs that regulate MSC senescence. Focus was on differential gene expression and the involvement of key signaling pathways (Figure 4). A total of 4597 DEGs were identified, comprising 2219 upregulated and 2379 downregulated genes, highlighting significant changes in gene expression accompanying MSC senescence. These results align with studies indicating that MSC senescence involves dysregulation of genes related to cell cycle control, apoptosis, and stress responses 23. The upregulation of CDKN1A (p21) observed in this study confirms its role in mediating cell cycle arrest by inhibiting cyclin-dependent kinases, thereby preventing progression through the G1 to S phase 24. This alteration represents a hallmark of cellular senescence, particularly in stem cells, and is associated with reduced proliferative capacity 25. Downregulation of CDK4 and CDK6 was observed, indicating that loss of these cell cycle regulators impairs cell cycle progression and accelerates senescence in MSCs 26. These findings suggest that the maintenance of MSC function and prevention of premature senescence are critically dependent on the regulation of these cell cycle genes.
Alterations in the mTOR, FoxO, and p53 signaling pathways were also identified, underscoring their central role in regulating cellular responses to stress, metabolism, and aging. In this dataset, CDKN1A (p21) was markedly upregulated while CDK4 and CDK6 were downregulated, confirming transcriptional enforcement of cell cycle arrest through p53-dependent mechanisms. The upregulation of TP53 and FOXO3, coupled with enrichment of the mTOR and FoxO signaling pathways in KEGG analysis, provides direct evidence that these pathways were transcriptionally activated during MSC senescence. These molecular alterations align with the phenotypic observations of reduced proliferation and SASP emergence, supporting the data-driven link between this study’s findings and the known biological functions of these pathways. The mTOR pathway, a critical regulator of cell growth and metabolism, has been implicated in both aging and cellular senescence. Previous studies have demonstrated that inhibition of mTOR signaling in MSCs delays senescence by enhancing autophagy and reducing oxidative stress 27. The observed disruption of mTOR signaling in senescent MSCs further supports its role in cellular homeostasis and aging regulation. Additionally, the upregulation of TP53 in senescent MSCs corroborates findings that p53 activation induces senescence in response to DNA damage and oxidative stress 25. The interaction between p53 and mTOR signaling has been shown to regulate cell cycle arrest and metabolic shifts during senescence, providing further evidence for the complex interplay between these pathways.
The FoxO transcription factors, particularly FOXO3, were found to play a critical role in regulating stress responses and promoting longevity. Increased FOXO3 expression in senescent MSCs aligns with previous findings suggesting that FoxO3 activation enhances resistance to oxidative stress and maintains cellular function during aging 28. These results suggest that the FoxO signaling pathway exerts a protective effect on MSCs by mitigating cellular stress and extending their functional lifespan. Senescent MSCs were observed to exhibit characteristic phenotypic changes, including altered morphology, reduced proliferative capacity, and the emergence of a SASP. These features are consistent with findings that senescent MSCs lose their differentiation potential and secrete pro-inflammatory cytokines, thereby impairing tissue regeneration 29. Furthermore, several SASP-related genes, including IL6, CXCL8, and MMP3, were significantly upregulated in senescent MSCs (adj. p<0.05), supporting the presence of a senescence-associated secretory phenotype in this dataset. The accumulation of such senescent cells in tissues is likely to contribute to aging-related pathologies and a diminished regenerative capacity of MSCs.
The elucidation of altered gene expression profiles, key pathway activations, and molecular mechanisms underlying MSC senescence provides a foundation for developing strategies to rejuvenate senescent MSCs. These strategies could enhance their regenerative potential and address age-related diseases more effectively. For example, interventions targeting SASP factors and promoting MSC rejuvenation have been demonstrated to improve therapeutic outcomes 30.
The results of this study suggest that targeting the mTOR, FoxO, and p53 pathways could provide effective strategies for delaying MSC senescence and enhancing their regenerative potential. Studies have shown that the mTOR inhibitor rapamycin extends the lifespan of MSCs and improves their differentiation capacity 31, while activation of FoxO3 has been demonstrated to protect MSCs from oxidative stress and delay senescence 32. The present study findings are consistent with recent reports that highlight the importance of mTOR and FoxO regulation in delaying stem cell aging and enhancing therapeutic efficacy 33. These studies reinforce the translational potential of targeting senescence-related pathways in MSC-based therapies. Additionally, the present data indicate that modulation of these pathways could significantly enhance the efficacy of MSC-based therapies. Future research should focus on the development of small molecules or gene-based therapies aimed at targeting these pathways and reversing MSC senescence.
Translational implications and future directions: While the present data indicate modulation of mTOR, FoxO, and p53 signaling during MSC senescence, therapeutic implications such as the use of rapamycin or FoxO3 activators should be considered as hypotheses requiring experimental validation.
Limitations: This study is limited by its reliance on a single public dataset (GSE7888), which may not capture donor-to-donor variability. Experimental validation of the identified genes and pathways is required in future studies.
Conclusion :
In conclusion, the core molecular signature of MSC senescence is characterized by enforced cell cycle arrest, marked by the upregulation of CDKN1A (p21) and the downregulation of CDK4 and CDK6. KEGG pathway and PPI network analyses further confirmed the coordinated dysregulation of three central signaling pathways-mTOR, FoxO, and p53 as key regulators of this functional decline. These molecular alterations are consistent with the phenotypic features of senescent MSCs, including the emergence of the deleterious SASP. These findings highlight the mTOR-FoxO-p53 axis as a promising therapeutic target for delaying MSC aging. Future work should explore small-molecule and gene-based strategies to modulate these pathways, while investigating the spliceosome complex as a potential novel regulator of MSC rejuvenation.
Acknowledgement :
We thank our colleagues and institutional support staff for their invaluable contributions and encouragement throughout this project. This research was approved by the Ethics Committee of Royan Institute, under the ethical code number: IR.ACECR.ROYAN. REC.1399.106. As a secondary data analysis, no IRCTID registration was necessary.
Conflict of Interest :
The authors declare no conflict of interest.
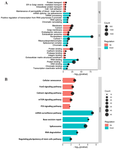
Figure 1. A) Gene Ontology (GO) analysis shows upregulated genes linked to organelle abundance and cellular maturation, while downregulated genes indicate declines in cell adhesion, apoptosis, and endocytosis during senescence. B) KEGG pathway analysis highlights enrichment in cellular senescence, FoxO, mTOR, calcium signaling, and spliceosome pathways, underscoring their role in aging regulation. Each analysis was performed using 24 hMSC samples (early passages 4-5; senescent passages 22-28).
Adjusted p-value <0.05 and |log2FC| ≥1 thresholds were applied.
|
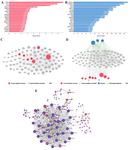
Figure 2. A-B) Analysis of top transcription factors (SPI1, YY1, SP1) and kinases (CDK2, CDK4, CDK6) reveals their regulatory roles in senescence. C-D) Gene network and transcription factor-gene-kinase interactions show high connectivity of key regulators in senescence. E) PPI network identifies critical genes (CDKN1A, TP53, FOXO3, MDM2) with strong connectivity in aging-related pathways. Each analysis was performed using 24 hMSC samples (early passages 4-5; senescent passages 22-28). Adjusted p-value <0.05 and |log2FC| ≥1 thresholds were applied.
|
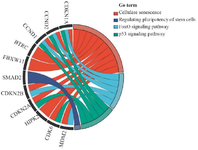
Figure 3. GO chord diagram visualizing relationships between key DEGs and their associated KEGG pathways in senescent MSCs. The top 12 genes with the highest |log2FC| and lowest adjusted p-values are displayed. Chord thickness represents gene–pathway connectivity strength based on DAVID analysis (adj. p<0.05).
|
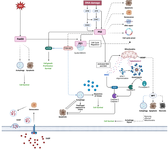
Figure 4. A summary diagram illustrating the molecular pathways inferred from the DEG and KEGG analysis of early vs. senescent MSCs. The model shows p53 activation triggering cell cycle arrest via CDKN1A upregulation, mTOR dysregulation affecting cell growth and metabolism, and FoxO3 modulating autophagy and apoptosis. The resulting cellular dysfunction and altered secretory profile lead to the Senescence-Associated Secretory Phenotype (SASP), which contributes to local inflammation and systemic aging.
|
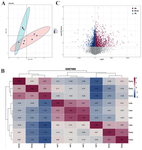
Figure S1. A) Principal Component Analysis (PCA) of the early and late groups in the GSE7888 dataset reveals significant differences in gene expression patterns between the two groups. B) The volcano plot in the GSE7888 study clearly illustrates significant differential gene expression, highlighting both upregulated and downregulated genes. C) The heatmap in the GSE7888 study also visualizes the differential gene expression, along with the classification and clustering patterns of the samples.
|
|