Proteome Analysis of Adult Acute Lymphoblastic Leukemia by Two-dimensional Blue Native/Sodium Dodecyl Sulfate Gel Electrophoresis
-
Bagheralmoosavi , Servin
-
Department of Immunology, School of Medicine, Shahid Beheshti University of Medical Sciences, Tehran, Iran
-
Gholami , Parastou
-
Department of Immunology, School of Medicine, Shahid Beheshti University of Medical Sciences, Tehran, Iran
-
Amini , Mahdi
-
Integrative Oncology Department, Breast Cancer Research Center, Motamed Cancer Institute, ACECR, Tehran, Iran
-
Alizadeh , Mahdi
-
Integrative Oncology Department, Breast Cancer Research Center, Motamed Cancer Institute, ACECR, Tehran, Iran
-
Yaghmaei, Marjan
-
Hematology, Oncology and Stem Cell Transplantation Research Center, Tehran University of Medical Sciences, Tehran, Iran
-
Tavakkoli, Sahar
-
Hematology, Oncology and Stem Cell Transplantation Research Center, Tehran University of Medical Sciences, Tehran, Iran
-
Salari , Sina
-
HSCT Research Center, Shahid Beheshti University of Medical Sciences, Tehran, Iran
-
Jeddi-Tehrani, Mahmood
-
Monoclonal Antibody Research Center, Avicenna Research Institute, ACECR, Tehran, Iran
-
Ghasempour , Alireza
-
Integrative Oncology Department, Breast Cancer Research Center, Motamed Cancer Institute, ACECR, Tehran, Iran
-
 Gilany, Kambiz
Reproductive Immunology Research Center, Avicenna Research Institute, ACECR, Tehran, Iran, Tel: +98 21 22439970; Fax: +98 21 22439970; E-mail: k.gilany@avicenna.ac.ir
Gilany, Kambiz
Reproductive Immunology Research Center, Avicenna Research Institute, ACECR, Tehran, Iran, Tel: +98 21 22439970; Fax: +98 21 22439970; E-mail: k.gilany@avicenna.ac.ir
-
Shabani, Mahdi
Department of Immunology, School of Medicine, Shahid Beheshti University of Medical Sciences, Tehran, Iran, Tel: +98 21 22439970; Fax: +98 21 22439970; E-mail: msshabani@sbmu.ac.ir
Abstract: Background: Despite the significant progress in the treatment of Acute Lymphoblastic Leukemia (ALL) in children, it still remains as one of the most challenging malignancies in adults. Identification of new biomarkers may improve the management of adult ALL. Proteins expressed on the cell surface can be considered as disease-associated biomarkers with potential for diagnosis and targeted therapies. Thus, membrane proteome studies give essential information about the disease-related biomarkers.
Methods: We applied 2-dimensional blue-native SDS-PAGE technique followed by MALDI-TOF/TOF-mass spectrometry to study the cell membrane proteome of peripheral blood mononuclear cells of adult B-ALL patients in comparison to that of the healthy controls.
Results: Sixty seven differentially expressed protein spots were detected, among them 52 proteins were found to be up-regulated but the other 15 proteins were down-regulated in B-ALL. Five differentially expressed proteins, involved in energy metabolism pathways, were detected in B-ALL patients compared to the healthy control group.
Conclusion: Differentially expressed proteins provide an insight into the molecular biology of B-ALL. Further studies must be done to confirm our data to be considered as potential targets for detection and treatment of B-ALL.
Introduction :
Acute Lymphoblastic Leukemia (ALL) is predominantly a childhood disease, but it is also the second most common acute leukemia in adults, with a peak around the fifties 1. Newly detected cases of ALL in the United States will be 6660 in 2022 2. Many genetic alterations that occur in ALL, cause not only the deregulated proliferation of hematopoietic lymphoid precursor cells but also their abnormal differentiation 3. ALL is immunophenotypically classified primarily as B- and T-lineages 4. B-cell precursor ALL (B-ALL) is the malignancy of B lymphoblast and accounts for ap-proximately 75% of adult ALL with poor long-term survival 5. Despite significant progress in childhood ALL treatment modalities, adult ALL remains one of the most challenging adult malignancies. In this regard, almost all developed and available drugs are limited to childhood ALL with poor efficiency for adult ALL patients 6. Thus, identifying new specific ALL-associated markers, especially cell membrane proteins, may improve our knowledge to better manage adult ALL.
Cell membrane proteins expressed on the surface of a cell are essential proteins whose abnormalities may be seen in different diseases such as cancer and may lead to alteration of phenotypic features of affected cells 7. Membrane proteomics is a valuable tool for finding disease-associated surface markers to assess membrane proteome. These markers may then potentially be used as drug targets 8. Several two-dimensional proteomic studies have been performed to find information about protein expression profiles in types of acute leukemia 9–13. It is well known that membrane proteins are hydrophobic proteins that complicate their solubilization.
Moreover, most of them are in complex forms 14. One of the main approaches for investigating membrane hydrophobic proteins and proteins in complex forms is two-dimensional blue native/sodium dodecyl sulfate-polyacrylamide gel electrophoresis (2D BN/ SDS-PAGE) 15. In the first dimension of this technique, the Coomassie Brilliant Blue (CBB) G250 dye reduces the hydrophobic character of the membrane proteins; then, these negatively charged proteins separate according to their molecular mass. In the second dimension, migration of subunits of protein complexes occurs based on their molecular weight 16. To the best of our knowledge, adult ALL has not been investigated for their membrane proteome by 2D BN/SDS-PAGE. Here, we first applied 2D BN/SDS-PAGE to compare proteome profiles of peripheral blood leukemic cells of adult ALL with normal Peripheral Blood Mononuclear Cells (PBMCs) of healthy controls to find adult ALL-specific protein patterns and then identified some differentially expressed proteins by MALDI-TOF/TOF-mass spectrometry.
Materials and Methods :
Subjects and samples: Heparinized peripheral blood samples were taken from three newly diagnosed adult ALL patients hospitalized in Tehran Hospital. Specialists confirmed ALL diagnosis according to the clinical findings and pathological studies of morphologic features of blast cells based on FAB classification 17. Among 15 newly diagnosed ALL patients, three B-ALL patients with peripheral blood leucocyte counts >40×106/mm3 and with more than 90% blast cells in their peripheral bloods were selected. The patients were 20-56 years old (median, 32 years). Clinical data related to the patient’s group are shown in table 1. Furthermore, three whole blood bags of healthy adults with a median age of 35 years (range 23-51 years old) were also provided by the Iranian Blood Transfusion Organization (IBTO) as normal controls. This study received ethical approval from the Ethics Committee of Shahid Beheshti University of Medical Sciences (IR.SBMU.MSP.REC.1396. 808). Furthermore, all subjects enrolled in the study gave written informed consents to participate in the study.
Peripheral blood mononuclear cell (PBMC) isolation: Leukemic and normal PBMCs were isolated by Ficoll-Hypaque (Sigma, Darmstadt, Germany) gradient centrifugation of blood samples. Briefly, blood samples were diluted 1:1 ratio by Phosphate-Buffered Saline (PBS). Diluted samples were added on top of Ficoll-Hypaque solution and centrifuged (400×g, 20°C) for 20 min. The leukemic and healthy PBMCs were washed with chilled PBS, pelleted in microcentrifuge tubes and stored at -80°C until use.
Cell membrane-associated protein lysate preparation: About 300 mg (wet weight) of frozen cell samples were resuspended in 1 ml of disruption buffer (83 mM sucrose, 6.6 mM imidazole/HCl, pH=7.0) and sonicated on ice for 10 min with 15 s bursts of sonication and 45 s intervals at maximum power with a sonicator (BANDELIN, Mecklenburg-Vorpommern, Germany). Lysates were centrifuged at 20000×g for 25 min at 4°C. Then 100 µl of solubilization buffer (50 mM sodium chloride, 50 mM imidazole/HCl, 2 mM 6-amino-hex-anoic acid, 1 mM EDTA, pH=7.0) were added to the pellets containing membrane-associated proteins. After homogenization for 10 min on ice, 15 µl of 20% digitonin were added to the samples, and supernatants were collected by centrifugation at 60000×g (Sigma 3K30, Sigma, Livingston, Germany) for 45 min at 4°C. Finally, 3 µl of 50% glycerol were added to the supernatants and stored at -70°C 18. Before electrophoresis, the protein contents were measured by a Bradford assay kit (Thermo Fisher Scientific, Rockford, IL, USA).
2D blue-native SDS-PAGE: 2D BN/SDS-PAGE was performed according to the method described previously 15,18,19 with some modifications. Briefly, 250 µg of prepared membrane-associ-ated protein samples were diluted by 7.5 µl of a 5% stock of CBB-G250 (Coomassie Brilliant Blue-G250) (Sigma) dye (prepared in 500 mM 6-amino-hexanoic acid) to give a detergent/dye ratio of 1:8. The first dimension (BN-PAGE) was performed in 3.5% stacking gel and 4-22% gradient separating gel in an electrophoresis unit (Bio-Rad, Hercules, CA, USA). The running buffers were pre-child with cathode buffer B (50 mM tricine, 7.5 mM imidazole, 0.02% w/v CBB G250) and anode buffer (25 mM imidazole, pH=7.0). Electrophoresis was performed initially at 100 V until the samples entered the gel and then continued with the current limited to 15 mA. The electrophoresis temperature was kept at 4°C till the end. When the deeply blue cathode buffer B had moved about one-third of the total electrophoresis distance, it was replaced with slightly blue cathode buffer B/10 (50 mM tricine, 7.5 mM imidazole, 0.002% w/v CBB G250) for better detection of protein bands. For the second dimension, the desired sample line from the first dimension was soaked in 1% SDS for 15 min, washed briefly in water, and placed between glass plates. Then 16% separating gel was poured between the glass plates. The gaps between the gel strip and spacers were filled with 10% acrylamide native gel. The electrophoresis was carried out at a constant current of 50 mA for about 10-12 hr. To determine the variability, each biological triplicate sample was subjected to 2-dimensional gel electrophoresis (2-DE) three times.
Gel image analysis and protein spot visualization: After 2D BN/SDS-PAGE, CBB was used for gel staining. Stained 2D gels were scanned with an image scanner (Bio-Rad). Gel images intensities were analyzed by 2D Platinum 6.0 software (GE Healthcare, Piscataway, NJ, USA) which detected spots automatically based on user defined the smooth and min area parameters. However, the spots were edited manually. The detected spots in the adult ALL related gels were compared to the healthy control spots. Protein levels that were increased or decreased at least 1.5-fold were considered significantly changed (p<0.05).
MALDI-TOF-TOF-mass spectrometry and database-mediated identification: Protein spots that were significantly deregulated between the patient and the healthy group were excised from 2-DE gels. In-gel digestion of proteins and MALDI-TOF-TOF-Mass Spectrometry was done as described previously 20. Briefly, protein spots were in-gel-digested with trypsin and the resulting extracted peptide mixtures were kept at -20°C for further analysis. The instrument we used for m/z of peptides was Applied Biosystems -4800 MALDI TOF/TOF™ Analyzer. Additionally, the matrix α-Cyano-4-hydroxycin-namic acid (ACCA) was used for analysis of peptide mixture. The proteins were identified by searching the peptide mass fingerprint data in Mascot software.
Results :
Comparative analysis of 2-DE gels of ALL and normal PBMCs: Density gradient media were used to separate leukemic and normal mononuclear cells. The percentage of lymphoblast in each of three ALL samples was more than 90% of peripheral blood leukocytes. 2-D BN/ SDS-PAGE was performed on normal and leukemic- lysates containing cell membrane-associated proteins. Approximately 170-185 spots were detected on each ALL gel by the auto-detection of 2D Platinum software, and the average match rate on the triplicate gels was 97%. 100-125 spots were detected for the normal PBMCs, and the average matching rate among them was approximately 70%. The matching rate among the normal and the ALL 2-DE gels was 50%, as presented in table 2. Sample 2 of the patient group was selected as the master gel, and the matching rate among each gel and the master gel was calculated accordingly (Table 2).
Protein identification by mass spectrometry: Mass spectrometric analysis showed that 67 differentially expressed protein spots between the leukemic and normal cells with a fold-change of >1.5 or <0.5 were significantly deregulated. In comparison with the control samples, 52 proteins were up-regulated, but the other 15 were down-regulated in the ALL samples (Figure 1). Furthermore, 24 protein spots were expressed only in the ALL, and 16 protein spots were detected just in the control group. Twelve protein spots were selected from the differentially expressed proteins, excised from the related gels, and digested with trypsin enzyme (Figure 1 and Table 3).
In the next step, peptides of the selected protein spots were analyzed by MALDI-TOF/TOF-MS, followed by analysis in the Mascote software with UniprotKB database for protein identification. The identities of the selected proteins were determined by considering the corresponding experimental pI, MW, the number of matched peptides, and the sequence coverage. Five out of 12 selected protein spots were identified by MALDI-TOF/TOF-MS analysis (Table 4). Some of the protein spots were not identified using the Mascot software caused by intensity of peptide mass, etc. Among the identified proteins, four were upregulated, and one was downregulated in the ALL group (Table 4). Gly-ceraldehyde 3-phosphate dehydrogenase (GAPDH), glutamate dehydrogenase 1 (GLUD1), serotransferrin, and hypothetical protein FLJ58286 were upregulated in ALL. However, the fibrinogen beta chain was downregulated in the ALL group. Most of the identified proteins were involved in different energy metabolism pathways.
Discussion :
In the present study, we used a new 2D BN/SDS-PAGE-based proteomics approach to identify cell membrane differentially expressed proteins between PBMCs of adult B-ALL patients and normal subjects. This could improve our knowledge to better understand the biology of adult ALL cells. Comparative analysis showed that 67 protein spots were differentially expressed and that five of them were identified by MS. Four out of five identified proteins were upregulated, and one was downregulated in ALL compared to normal samples.
Variations in the glycolysis pathway, which Warburg first pointed out in 1920 21 are proved in different solid tumors 22. According to the Warburg effect, tumor cells metabolize more glucose in the glycolysis pathway under aerobic conditions than in the oxidative phosphorylation pathway. This leads to more lactate production, which makes the microenvironment more acidic, which is toxic for normal cells 23. GAPDH, an enzyme of the glycolysis pathway, plays a vital role in pyruvate production. This pyruvate then converts to lactate and produces two ATP molecules. Previous studies on ALL disease have reported upregulation of glucose metabolism at proteomics and transcriptomics levels 24–26.
Moreover, Handschuh et al reported upregulation of GAPDH mRNA levels in AML patients compared to the normal cells 27. Our results showed that cellular levels of GAPDH are increased in B-ALL cells compared to the normal ones that is compatible with other reported studies. This finding implies that adult B-ALL cells might also apply GAPDH under aerobic conditions for pyruvate production.
Glutamine metabolism is another altered metabolism pathway in cancer cells. After entry into the cell via transporters, glutamine is converted to glutamate, which is then converted to α-ketoglutarate by GLUD1 or GLUD2 28. This pathway is augmented in the proliferating cells, including cancer cells. Furthermore, these cells consume most of the glutamine for building proteins 29. Craze et al’s results showed increased levels of GLUD1 in breast cancer cells 30. In hematological malignancies, the relationship between increased levels of GLUD1 and B-CLL cells has been previously reported 31. Accordingly, our data showed that GLUD1 is upregulated in adult B-ALL patients.
Serotransferrin, a glycoprotein produced by the reticuloendothelial system, is the human body’s iron transporter. Due to the critical role of iron in the cell cycle, iron-related proteins in tumor cells must be upregulated to meet the intracellular iron demand 32. Upregulation of intracellular iron was reported in cells and sera of ALL patients 33. Moreover, iron receptors on cell surfaces have been reported to be overexpressed in some hematological malignancies such as CLL 34, AML 35 and B- and T-ALL 36. Interestingly, the current study also found upregulated levels of serotransferrin in adult B-ALL cells compared to the normal cells.
Hypothetical protein FLJ58286, like cytoplasmic actin 2, was also upregulated in B-ALL cells. However, there is no research regarding the relationship of this protein with hematological malignancies. Our results showed that fibrinogen beta chain, an essential protein in blood coagulation, was decreased in ALL cells. Elevated levels of fibrinogen is reported in a variety of common cancers such as hepatocellular carcinoma 37, ovarian cancer 38, gastric cancer 39, and glioblastoma 40. Although the relationship between newly diagnosed B-ALL and fibrinogen is not well studied some studies reported hypofibrinogenemia in adult ALL patients treated with L-asparaginase. This happens due to the inhibition of L-asparagine-dependent protein synthesis such as fibrinogen and antithrombin 41.
Conclusion :
In summary, we compared cell surface proteome of adult B-ALL patients with that in normal subjects to find differences in protein expressions. We found some differentially expressed proteins between two groups which provides an insight into the molecular biology of the disease. Further studies must be done to confirm our data to be considered as potential targets for early detection and treatment of the disease.
Acknowledgement :
The authors are thankful to the personnel of the Oncology Department of Taleqani and Shariati Hospitals for supporting us in taking blood samples of the patients. We also thank the Iranian Blood Transfusion Organization (IBTO) for providing blood bags of healthy adults. This article was extracted from the thesis written by Servin Bagheralmoosavi in the School of Medicine, Shahid Beheshti University of Medical Sciences.
Funding: This study was financially supported by Shahid Beheshti University of Medical Sciences with grant number 12009 and by Avicenna Research Institute with grant number 960405-013.
Conflict of Interest :
The authors declare that they have no conflict of interest with the contents of this article. All the authors of this study agreed to participate in this study. The corresponding authors accept responsibility for releasing this material on behalf of all co-authors.
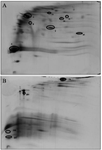
Figure 1. Representative images of A) 2D BN/SDS-PAGE map of cell membrane-associated proteins of PBMCs of ALL and B) normal samples. Selected differentially expressed proteins in the two groups are shown by numbers.
|
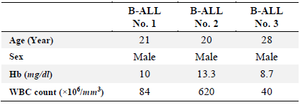
Table 1. Demographic and paraclinical data related to the selected B-ALL patients
|
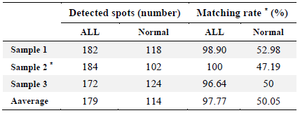
Table 2. Match statistics report of detected spots in ALL and normal 2D gels
*Sample 2 was considered as the master gel for matching rate calculations.
|
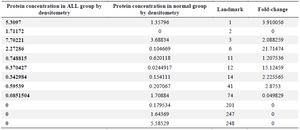
Table 3. Protein concentrations and fold changes of the selected differentially expressed proteins for mass spectrometry analysis
|
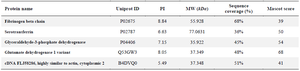
Table 4. Identification of the deferentially expressed proteins in ALL samples by MALDI-TOF mass spectrometry
|
|