An Integrated Bioinformatics Analysis of the Potential Regulatory Effects of miR-21 on T-cell Related Target Genes in Multiple Sclerosis
-
Manian, Mostafa
-
Department of Immunology, Faculty of Medicine, Iran University of Medical Sciences, Tehran, Iran
-
Sohrabi, Ehsan
-
Department of Medical Genetics and Molecular Biology, Faculty of Medicine, Iran University of Medical Sciences, Tehran, Iran
-
Eskandari, Nahid
-
Department of Immunology, Faculty of Medicine, Isfahan University of Medical Sciences, Isfahan, Iran
-
Assarehzadegan, Mohammad-Ali
-
Department of Immunology, Faculty of Medicine, Iran University of Medical Sciences, Tehran, Iran
-
mmunology Research Center, Institute of Immunology and Infectious Diseases, Iran University of Medical Sciences, Tehran, Iran
-
Ferns, Gordon A.
-
Brighton and Sussex Medical School, Division of Medical Education, Falmer, Brighton BN1 9PH, Sussex, UK
-
Nourbakhsh, Mitra
-
Department of Biochemistry and Nutrition, Faculty of Medicine, Iran University of Medical Sciences, Tehran, Iran
-
 Jazayeri, Mir Hadi
Iran University of Medical Sciences, Tehran, Iran, Tel: +98 21 88622652; E-mail: Jazayeri.mh@iums.ac.ir, molecular_biology@mail.mui. ac.ir
Jazayeri, Mir Hadi
Iran University of Medical Sciences, Tehran, Iran, Tel: +98 21 88622652; E-mail: Jazayeri.mh@iums.ac.ir, molecular_biology@mail.mui. ac.ir
-
Department of Immunology, Faculty of Medicine, Iran University of Medical Sciences, Tehran, Iran
-
Immunology Research Center, Institute of Immunology and Infectious Diseases, Iran University of Medical Sciences, Tehran, Iran
-
Nedaeinia, Reza
Pediatric Inherited Diseases Research Center, Research Institute for Primordial Prevention of Non-Communicable Disease, Isfahan University of Medical Sciences, Isfahan, Iran, Tel: +98 21 88622652; Email: Reza.nedaie@gmail. com
Abstract: Background: Overexpression of miR-21 is a characteristic feature of patients with Multiple Sclerosis (MS) and is involved in gene regulation and the expression enhancement of pro-inflammatory factors including IFNγ and TNF-α following stimulation of T-cells via the T Cell Receptor (TCR). In this study, a novel integrated bioinformatics analysis was used to obtain a better understanding of the involvement of miR-21 in the development of MS, its protein biomarker signatures, RNA levels, and drug interactions through existing microarray and RNA-seq datasets of MS.
Methods: In order to obtain data on the Differentially Expressed Genes (DEGs) in patients with MS and normal controls, the GEO2R web tool was used to analyze the Gene Expression Omnibus (GEO) datasets, and then Protein-Protein Interaction (PPI) networks of co-expressed DEGs were designed using STRING. A molecular network of miRNA-genes and drugs based on differentially expressed genes was created for T-cells of MS patients to identify the targets of miR-21, that may act as important regulators and potential biomarkers for early diagnosis, prognosis and, potential therapeutic targets for MS.
Results: It found that seven genes (NRIP1, ARNT, KDM7A, S100A10, AK2, TGFβR2, and IL-6R) are regulated by drugs used in MS and miR-21. Finally, three overlapping genes (S100A10, NRIP1, KDM7A) were identified between miRNA-gene-drug network and nineteen genes as hub genes which can reflect the pathophysiology of MS.
Conclusion: Our findings suggest that miR-21 and MS-related drugs can act synergistically to regulate several genes in the existing datasets, and miR-21 inhibitors have the potential to be used in MS treatment.
Introduction :
Multiple Sclerosis (MS) is a common neurological disorder, which is more prevalent in women than men, and is identified by demyelination, chronic inflammation, and progressive neurological dysfunction 1,2. The etiology of this chronic inflammatory disorder is unclear; however, acute interstitial inflammation of nerves and the presence of multifocal sclerotic plaques in different parts of the peripheral and central nervous system are common manifestations 3. A fundamental characteristic of MS is an antigen-specific autoimmune response 4. MS is a polygenic disease in which each gene has a small effect on the overall risk 5. Recent genome-wide association studies have identified about 100 gene variants that are associated with a predisposition to MS. Most of these genes are considered to play a role in immunity 6. MicroRNAs have been proposed as biomarkers for the early detection of MS 7,8. Mature miRNAs are ~18–22 nucleotide single-stranded endogenous RNAs that bind to their target sequence on mRNA and regulate gene expression 9. miRNAs are responsible for regulating the expression of more than 60% of mammalian protein-coding genes 10. The expression profile of miRNA in MS patients has been studied and a large number of DEGs have been identified 11. For example, there is strong evidence that miR-21 expression is up-regulated in MS patients compared with healthy controls 12. These miRNAs are highly conserved non-coding RNAs involved in post-trans-criptional regulation 13. miRNAs appear to be potentially useful as diagnostic biomarkers for MS, and it has been shown that the differential expression of these miRNAs is dependent on the time of onset and therapeutic stage. Recent studies have demonstrated that miRNAs may also have essential roles in MS pathogenesis 14. It is, therefore, possible that they could be used as both diagnostic markers and therapeutic targets in MS (Table 1) 15,16. Although the function of miR-21 has been relatively well studied, its role in the development and progression of MS disease remains unclear. Satoh et al used proteomic profiling of MS brain lesions and analyzed the extracellular pathway to reveal the association between adhesion and integrin sig-naling in the progression of chronic MS lesions 17. Freiesleben et al assessed microarray data of peripheral blood and integrated genes of MS patients using a consensus method that determines the degree of agreement of inconsistent data 18. Studies performed using a variety of tissues such as brain lesions, and peripheral blood have been of relatively small cohort size and have not been replicated 19. It is worth pointing out that this study investigated microarray profiling of miRNA of appropriate size patient cohort, introduced the approach of the molecular network, and generated consensus interaction network between differentially expressed miRNAs and genes in T-cells of untreated MS patients to identify dysregulated miRNAs and their target genes. To study the complex heterogeneity of multiple sclerosis for identifying MS-associated molecular functional networks in cells and dysregulated molecular mechanisms and pathways, integrative analyses seem to be more efficient in identifying a potential therapeutic target than the assessment of individual genes 6,19,20. Bioinformatics analysis of gene expression profiling has recently been used to identify genetic alterations at RNA level, and transcription factors can be applied as biomarkers for human diseases such as MS 21. Bioinformatics analysis and systems biology can reveal molecular signatures comprising biomolecules at the protein level, drug, and RNA levels (miRNAs), and pathways have been used to obtain a more detailed understanding of the mechanisms involved in the pathogenesis of MS 22,23. In the current study, a new integrated bioinformatics analysis was used to obtain a more detailed understanding of the mechanistic impact of miR-21 in MS, its protein biomarker signatures, RNA levels (mRNAs, miRNAs), and drug interactions by using the existing microarray databases of MS. MiR-21 was selected based on the reported dysregulation of this microRNA in MS 24. Online databases such as HMDD v3.2, miR2Disease, and PhenomiR were used to determine the importance of miR-21 in gene regulation in MS. This study aimed to create a molecular network of miRNA genes and drugs, based on differentially expressed genes in T-cells of patients with MS, to identify the targets of miR-21, which act as important regulators and potential biomarkers in the early diagnosis, prognosis, and potential therapeutic targets for MS.
Materials and Methods :
Data collection for gene expression analysis: Using a consistent specific platform, microarray datasets containing raw or normalized data were collected from the Gene Expression Omnibus (GEO) database. In order to collect comprehensive information, "multiple sclerosis", "Homo sapiens", and study type (Expression profiling by array) were selected as keywords for the search in the GEO database. Finally, data were obtained from 5 mRNA microarrays (GSE43592, GSE13732, GSE16461, GSE78244, and GSE81279). The overall analysis process for this study is shown in figure 1 and the frame used for the selection of these datasets is shown in figure 2. The selected datasets included gene expression profiling using microarray in T-cells of patients with MS but datasets in which patients underwent treatment were excluded (Table 2). p<0.05 was set to determine significant expression changes. The study was expanded by adding in-silico predicted miRNAs based on available MS-related genes and pathways.
Data preprocessing and analyzing of microarray: The GEO2R interactive web tool (https://www.ncbi. nlm.nih.gov/geo/info/geo2r.html), using the GEO query and limma R packages, was applied for the analysis and comparison of the expression profiles of MS samples with controls in order to identify significant differences in gene expression after GEO2R analysis and obtain a final list of significant genes based on p<0.05 (Cut off ). The final results of the analysis of DEGs for up- and down-regulated genes were obtained by using cut off values for p<0.05 and log Fold Change (logFC) >1 or log FC<−1. According to this novel approach of combining microarray analysis and bioinformatics tools, common differentially expressed genes were identified and selected between the predicted targets of miR-21 and microarray datasets using a Venn diagram for showing T-cells from patients with MS. To investigate the potential role of miR-21 in gene regulation in MS, publically available microarray datasets containing non-coding RNA of peripheral blood profiles of controls and patients were downloaded which corresponded to platform specifications of GEO database 31. Studies in which patients were receiving therapy or in which samples were not obtained from blood, were excluded. At least seven replicates of the examined GSE31568 dataset containing each miRNA were measured, and the median of the replica was computed. To process the collected data more specifically, experimentally validated targets of miR-21 were searched and used to construct a primary miRNA-mRNA-drug regulatory network.
Prediction of miRNA target genes: The predicted targets of miR-21 were obtained from the online functional annotation tool, mirDIP 4.1 (http: //ophid.utoronto.ca/mirDIP/),which provides 152 million human microRNA–target predictions, collected across 28 different resources (BCmicrO , BiTargeting, CoMeTa, Cupid, DIANA, ElMMo3, GenMir++, MicroRNA.org, miRBase, mirCoX, miRcode, miRDB, miRTar2GO, MAMI, MBStar, MirAncesTar, MirMAP, MirSNP, MirTar, Mirza-G, MultiMiTar, PACCMIT, PicTar, PITA, RepTar, RNA22, RNAhybrid, TargetRank, TargetScan, and TargetSpy) 37. Then, the target genes were aligned with the DEGs in MS, and this was used for further analysis.
Independent validation by RNA-sequencing (RNA-seq): Independent validation of the 44 common genes as candidate key genes was derived by integrated microarray analysis results and miRNA targets and independent samples of MS and healthy controls from RNA-seq experiment (GEO accession no. of GSE 94266) were selected. The original experiment was designed to determine the Differentially Expressed Genes (DEGs) in MS patient versus healthy controls. Quality control of reads was analyzed using FastQC package (https://www.bioinformatics.babraham.ac.uk/projects/fastqc/). Low quality reads and adaptor sequences were trim-med by the CLC Genomics Workbench 12.0.3 (QIAGEN, Germany). Mapping of short reads to the reference genome was performed using the CLC Genomics Workbench. Raw counts were obtained and used for Differential Expression (DE) analysis. The differential expression analysis was performed using DESeq2 and genes with p≤0.05 were defined as Differentially Expressed Genes (DEGs).
Functional and pathway enrichment analysis: The Gene Ontology (GO) enrichment analysis including Biological Process (BP), Molecular Function (MF), and cellular component (CC), and the Kyoto encyclopedia of genes and genomes (KEGG) pathway enrichment analyses of common genes were carried out using the Enrichr database, which is a bioinformatics data platform consisting of an extensive biology knowledge database and analysis tools to align and explore significant biological information from large quantities of genes and protein collections 38. A p<0.05 was used as the cut off criterion to determine the important pathways in which the genes are involved.
PPI network construction: The STRING (Search tool for the retrieval of interacting genes) database (http://string-db.org/) was used for constructing common DEGs network by calculating the protein-protein interaction.
Prediction of drug–gene interaction: Drugs and their target genes were downloaded from the drug-gene interaction database (DGIdb v3.0, www. dgidb.org) 39,40. DGIdb normalizes content from 30 different sources and provides access through an intuitive web user interface, Application Programming Interface (API), and public cloud-based server image 40. In addition, Cytoscape software was applied to extend gene-drug interaction network.
miRNA- mRNA-drug interaction network: mRNA-miRNA and drug-based disease-associated regulatory network were assessed by using microarray datasets in order to identify the relationship between miR-21, differentially expressed genes, and well-known drugs in MS. To create networks between miRNA-genes and drugs, common genes between DEGs and predicted miR-21 targets and related drugs were selected to obtain the intersection for creating networks using Cystoscape software (https://cytoscape. org/).
Results :
Verification of miR-21 in MS: In order to develop a miRNA gene-based disease-associated network, data were collected by three different methods to identify miRNAs associated with MS. MiR-21 was selected as a candidate biomarker in MS, based on previous findings regarding the role of miR-21 in gene regulation in the etiology of MS. There was a statistically significant increase in expression of miR-21 in the peripheral mononuclear cells of patients with Relapsing-Remitting (RR) MS compared to controls. For in silico analysis, the GSE31568 dataset contained 23 MS samples and 70 control samples and based on GPL9040 platform (febit Homo Sapiens miRBase 13.0), there was significantly up- and down-regulated miR-21 in peripheral blood cells (Table 3).
Identification of differentially expressed genes (DEGs) in MS patients: The five selected datasets were downloaded directly from GEO (https://www.ncbi.nlm.nih.gov/geo/) database and analyzed using GEO2R. They were identified as 7502, 14776, 1840, 3927, 140 DEGs in GSE43591, GSE13732, GSE16461, GSE78244, and GSE81279 and composed of up-and down-regulated expression based on criteria of log fold change >1 or <-1 and p< 0.05 in MS as described in table 3 and figure 3. Genes of datasets that were differentially expressed in the same gene symbol or overlapping gene, at least two of the five datasets, were selected (Figure 3). In total, 680 genes were obtained based on criteria of p<0.05 for carrying out the process analysis. Based on this novel approach, 44 genes (Table S1) were identified that overlapped as differentially expressed genes between the predicted target of miR-21 (994 genes) and microarray datasets (680 genes) using a Venn diagram (Table S2, Figure 4).
Identification of predicted target genes for miR-21: In this study, 994 predicted genes as potential target genes of miR-21 were obtained by using mirDIP. All genes shown in table S1 were predicted by mirDIP as targets of miR-21. Then, the target genes were aligned with the DEGs in MS, and this was used for further analysis.
RNA sequence analysis: Our analysis identified 6332 mRNAs that were significantly differentially expressed between MS and healthy subjects (p<0.05), defined as differentially expressed genes. Then, overlapping genes between these genes and significant genes (44 common genes) and 18 mRNAs (p<0.05, 1<│LogFC│<-1) were shown by microarray analysis (Figure 5).
GO and KEGG pathway enrichment analyses of common genes: GO and KEGG pathway enrichment analyses were performed for further investigation of the functional role of common DEGs and key pathways in MS patients. First of all, all common DEGs which had been submitted to the Enrichr online database were analyzed.
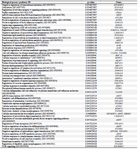
As shown in table 4, signaling pathway analysis was performed using KEGG analysis for all common DEGs (44 genes). The results of KEGG enrichment analysis showed that the common DEGs were mainly enriched in inositol phosphate metabolism, sulfur metabolism, phosphatidylinositol signaling system, HIF-1 signaling pathway, Th17 cell differentiation, and thiamine metabolism. For Cellular Component (CC), results of the top five GO terms (Table 5) reveal that 44 common DEGs were significantly enriched at microtubule minus-end, nuclear periphery, microtubule end, mitotic spindle pole, and membrane raft-mediated pathway (Table S3). For Biological Processes (BP), results of the top five GO enrichment analyses (Table 6) show that they were significantly enriched and contained protein K63-linked deubiquitination, negative regulation of protein depolymerization, protein K48-linked deubiquitination, cellular response to interleukin-6, and regulation of interleukin-6 production (Table S4). In addition, according to the results of the top five GO analyses shown in table 7, 44 common DEGs were significantly enriched in Molecular Function (MF), including Lys63-specific deubiquitinase activity, ubiquitin-like protein-specific protease activity, thiol-de-pendent ubiquitin-specific protease activity, thiol-de-pendent ubiquitin hydrolase activity, and polyubiquitin modification-dependent protein binding (Table S5).
Construction of protein-protein interaction network: To assess the protein-protein interaction network, all DEGs were submitted to STRING. As shown in figure 6, PPI network analysis introduced 44 nodes and 6 edges for the common DEGs based on the PPI network modules and PPI enrichment with p-value of 0.638.
Recognition of drugs related to common DEGs: Next, an analysis of all the common DEGs using DGIdb v3.0 was carried out to detect affected genes associated with drugs in MS. An in-depth dissection of the effects of drugs on genes in MS was developed. These results demonstrated that seven genes in MS were targeted by drugs. According to table 8, multiple drugs have regulatory and inhibitory roles in MS patients’ genes.
Construction of regulatory miRNA-mRNA-drug network: This approach was eventually used to develop a miRNA-mRNA-drug interaction network and identify key genes co-regulated by miR-21-5p and drugs. To illustrate the complex correlation between drugs and gene targets of miR-21, a layered network using Cytoscape v3.6.1 was created that can provide more detailed information regarding these relationships. By integrated analyses, it was shown that 7 genes (NRIP1, ARNT, KDM7A, S100A10, AK2, TGFβR2, and IL-6R) were regulated by obtained drugs and miR-21; in fact, miR-21 and drugs can synergistically regulate pathways in MS disease by regulating these genes (Figure 7).
Discussion :
The involvement, functions, and complexity of miRNAs in autoimmune diseases are still unclear, especially in MS, due to the inadequate number of microarray expression profiles in MS studies 18. Overexpression of miR-21 in patients with MS may be a signature in regulating genes and enhanced expression of pro-inflammatory factors such as IFNγ and TNF-α after TCR stimulation. Up-regulation of miR-21 has been found in autoimmune diseases like IBD (Inflammatory Bowel Disease), SLE (Systemic Lupus Erythematosus), and psoriasis. Our findings suggest that miR-21 could be a target in clinical treatment for the inflammatory component of MS 24. Also, previous experimental studies have documented that T-cells transfected with miR-21 secreted IFN-γ and TNF-α by affecting promoter regions and have binding sites for several transcriptional factors such as AP-1, STAT-3, MyD88, and NF-kB 29. MiR-21 directly inhibits the expression of PDCD4 that acts as a biomarker in pathogenic T-cell apoptosis and cell proliferation in human SLE. Overexpression of miR-21 can lead to up-regulation of multiple genes which cause inflammation via activation of pathways such as NF-kB and MAPK 41. miR-21 indirectly regulates Foxp3 expression 42. Induced miR-21, upon TCR activation, regulates several signaling pathways including ERK, AP-1 and AKT through negative feedback. Activation of these signaling pathways results in increased effector cells and decreases memory T-cell differentiation 43. Since predicting promoter region of pri-miR-21 is complex 29 and the exact roles of miR-21 are undetermined in MS disease, targeting miR-21 seems to be useful in developing a treatment based on the new approach. In the present study, publicly available microarray databases were used to analyze significantly differentially expressed genes in MS patients and to identify molecular interactions between miR-21-mRNA and drugs for demonstrating biochemical mechanisms related to MS. Therefore, a miRNA- and a gene-drug network was created. Our network is different from previous studies in the literature because it is based on specific microarray datasets of T-cells in MS and pathway genes related to drugs. Also, our study identified 44 significantly up- and down-regulat-ed common genes that may reflect the pathology and progression of MS. In this study, 44 new DEGs were found in T-cell MS datasets with overlap between at least three out of five microarray datasets. In the present study, to identify 994 putative target genes of miR-21, miRDIP was used which contained 28 different resources of functional annotation datasets. In addition, to obtain a final list of significant DEGs in T-cells from patients with and without MS, an analysis of five different datasets was performed, which identified 679 MS-associated genes. Integrated analysis between predicted target genes of miR-21 and DEGs of datasets revealed 44 common DEGs as overlapping genes that were associated with the development and progression of MS disease. Our findings revealed 7 up-regulated and 15 down-regulated genes at the intersection of the 44 common DEGs with five datasets that might be targets of miR-21 for the therapeutic approach. Therefore, the detection of putative target genes of miR-21 might identify how this miRNA controls different cell signaling pathways and molecular mechanisms in MS disease. The results of GO annotation revealed that some genes, such as ATXN3, IL6R, AK2, ARNT, and TGFBR2 are mutually and significantly effective between pathways related to MS disease. Also, the results of KEGG pathway enrichment analysis showed that the IL6R, AK2, ARNT, and TGFBR2 were the most significant genes in the HIF-1 signaling pathway, Th17 cell differentiation, and thiamine metabolism pathways. Also, previous in vitro and ex vivo experimental studies have revealed that human Th17 cells were associated with disease activity and downstream pathways in the pathogenesis of autoimmunity 44 and they play distinctive effector roles in MS patients 45. In addition, new drugs that targeted TH17 pathway such as Secukinumab (Cosentyx), human IgG1κ monoclonal antibody against IL-17A, can help in monitoring the disease activity and their potential role in inhibiting Th17 cell differentiation as therapeutic targets in the treatment of autoimmunity disorders 44 is confirmed based on findings in Experimental Autoimmune Encephalomyelitis (EAE) (MS disease model), and discovery of the biology and function of Th17 in encephalitogenicity 46. To discover the functions and roles of 44 common DEGs in MS disease, their correlation with MS-related drugs was assessed and regulatory and inhibitory effects of drugs on genes of MS patients were found. These results, based on the scoring criteria, can confirm the findings of GO and KEGG analysis that IL6R, AK2, TGFBR2, and ARNT genes are significantly effective in MS disease. These results indicate the potential therapeutic targets of DEGs in autoimmune MS disease. Through integrated analysis of both hybrid miRNA-mRNA drug network with the Cytoscape, this study identified a noticeable relation between miR-21 and genes, indicating that miR-21 could play pivotal roles in regulating pathways and phenotypes of MS. Interestingly, the regulation of TGFBR2 by miR-21 has been demonstrated by Luo et al similar to our analysis 24. Moreover, Meira et al have reported the significant down-regulation of TGFBR2 expression in RRMS patients compared to healthy controls 47. In our analysis, ARNT genes were mainly involved in MS disease pathways, whereas Zorlu et al showed that this gene is consistently associated with MS in patients at the secondary progressive phase of the disease 48. AK2 as a novel apoptotic pathway 49, the pivotal role of the AK2 gene in hematopoiesis, and its association with a pathway controlling cell growth and survival were all explained by previous research 50. Although the exact role of AK2, ARNT, and ATXN3 in MS disease has not been studied yet, they be candidate therapies for MS disease. However, the effect of miR-21 on AK2, ATXN3, and ARNT has not been studied in MS disease and requires further investigation. miRNA is an ideal candidate for therapeutic targets due to the role of miRNAs in controlling various gene expression in cancer and several other diseases, in particular autoimmune diseases 51. Nineteen genes among common genes were validated with RNA sequencing in this study. Finally, three overlapping genes (S100A10, NRIP1, KDM7A) were identified between miRNA-gene-drug network and nineteen genes as hub genes that may reflect the pathology of MS. It has been found that NRIP1 is involved in CNS-mediated neurophysiological processes and administration of Toll like-receptor ligands affects inflammatory potential in macrophages through their function as co-activators for NF-κB 52. He et al have mentioned that methylation is controlled by histone lysine methyltransferases (KMTs) and demethylases (KDMs) that possess strong substrate specificity and they have reported that histone lysine demethylases (KDMs) such as KMD7A play critical roles in the pathogenesis of MS 53. It has been identified that S100A10 as the specific marker of A2 astrocytes is essential for cell proliferation, membrane repair, and inhibition of cell apoptosis. Astrocytes play a key role in demyelinating diseases, like multiple sclerosis 54. Recent data demonstrate that artificial antisense miRNAs, such as Locked Nucleic Acid (LNA), bind to complementary RNA with high affinity and have stability and low toxicity without inducing the immune response 55; therefore, they could be applied to block their targeted oncomiRs to prevent the development of cancer. Also, antisense miRNAs as a gene silencing factor could significantly affect the prognosis of the disease 51. In particular, LNA against miR-122 represents an effective approach in the treatment of hepatitis C (Phase II trial) 55.
Conclusion :
The computational approach used in this study demonstrated the role of miR-21 as a regulator of the MS-related signaling pathways which can be a potential target for therapeutic modalities. Based on complex miRNA-mRNA interactions, genes targeted by many miRNAs have several sites for the same miRNA. However, the findings of the current study should be confirmed with available techniques such as real-time PCR and western blotting or luciferase assay. Since experimental validation of miRNA targets with laboratory techniques is expensive and cumbersome, the results of current bioinformatic approach would be an effective method for guiding in vivo and in vitro experiments.
An integrated miRNA-mRNA-drug network was developed to analyze predicted MS-associated target genes of miR-21, followed by functional enrichment assessment of the miR-21 targeted DEGs in MS patients. Based on the crucial effect of miR-21 on genes in MS patients, our research suggests applying miR-21 inhibitors such as locked nucleic acid (LNA)-modified oligonucleotides that are known as stable, non-toxic drugs which do not induce an aberrant immune response 58. Altogether, these findings can provide new insights into pathogenicity mechanisms of MS, therapeutic development, and interventions. Further studies are required to confirm the results of the present study in MS patients.
Availability of data and materials: All data generated or analyzed during this study are included in this published article.
Acknowledgement :
This work was extracted from the Ph.D. thesis and financially supported by Vice Chancellor for Research Affairs of Iran University of Medical Sciences, Tehran, Iran through the registration No: 15.
Conflict of Interest :
The authors declare no conflict of interest.
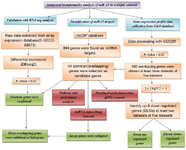
Figure 1. The bioinformatics flowchart used in the current study. DEGs: differentially expressed genes, PPI: protein-protein interaction, GEO: gene expression omnibus.
|
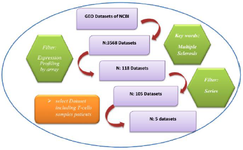
Figure 2. Outline of the protocol used for the search of multiple sclerosis microarray datasets from the GEO database.
|
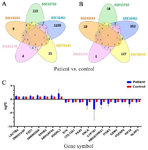
Figure 3. A) Venn diagram represents the number of overlapping differentially down-regulated genes between datasets based on │Log FC│<-1 and p<0.05. Eleven overlapping genes, at least two datasets, were shown. B) Venn diagram represents the number of overlapping differentially up-regulated genes between datasets based on │Log FC│>1 and p<0.05. Seven overlapping genes, at least two datasets, were shown. C) differentially up- and down-regulated genes between datasets in MS patients versus healthy controls.
|
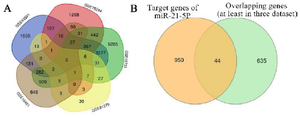
Figure 4. A) 680 overlapping genes, at least three of the five GEO datasets, by Venn diagram with p<0.05. B) The common DEGs (44 genes) as overlapping genes of the predicted target genes of miR-21, at least three of five datasets, using process analysis demonstrated by Venn diagram. miR: microRNA, DEGs: differentially expressed genes, MS: multiple sclerosis.
|
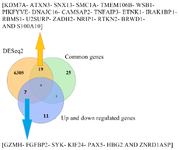
Figure 5. Venn diagram represents the number of overlapping differentially expressed genes between significant genes (n=6332) of RNA-seq analysis, 44 common genes and 18 up- and down-regulated genes in multiple sclerosis disease. Validation of microarray result by RNA-seq showed 19 and 7 overlapping genes with common genes and up- and down-regulated genes, respectively.
|
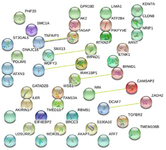
Figure 6. Protein-protein interaction of 44 common differentially expressed genes (DEGs) identified in multiple sclerosis by STRING.
|
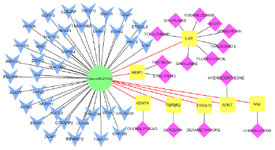
Figure 7. miRNA-mRNA-drug interaction network constructed by Cytoscape; miR-21 regulates common DEGs and is related with genes affected by MS-associated drugs. Blue: common DEGs, Yellow: common DEGs affected by drugs, Pink: MS-associated drugs.
|
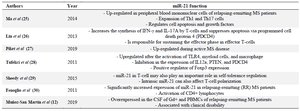
Table 1. An overview of the role of miR-21 in multiple sclerosis
|
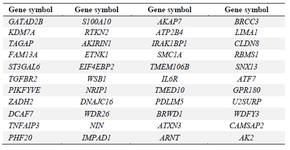
Table S1. 44 genes were identified that overlapped as differentially expressed genes between the predicted target of miR-21 and microarray datasets
|
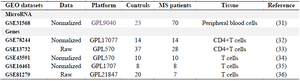
Table 2. Characteristics of the five gene expression profiling datasets for multiple sclerosis in integrated bioinformatics analysis
|
Table S2. 680 overlapping genes, at least three of the five GEO datasets, with p<0.05
|
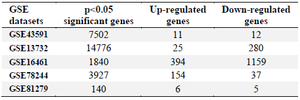
Table 3. Microarray profiling for differential gene expression in T-cells of MS patients
|
Table S3. GO enrichment (Cellular component pathway) analyses of 44 common differentially expressed genes (DEGs) with p<0.05
|
Table 4. Significantly enriched KEGG signaling pathways of the differentially expressed genes identified in multiple sclerosis
|
Table S4. Biological process enrichment analyses of 44 common differentially expressed genes (DEGs) with p<0.05
|
|
|
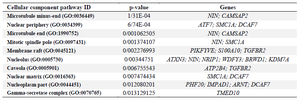
Table 5. Ten top GO enrichment analyses of 44 common differentially expressed genes (DEGs) with p<0.05
|
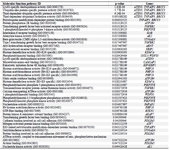
Table S5. molecular functions enrichment analyses of 44 common differentially expressed genes (DEGs) with p<0.05
|
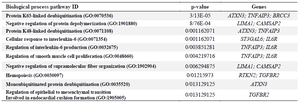
Table 6. Ten top biological process enrichment analyses of 44 common differentially expressed genes (DEGs) with p<0.05
|
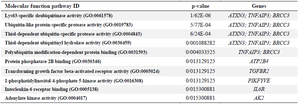
Table 7. Ten top molecular functions enrichment analyses of 44 common differentially expressed genes (DEGs) with p<0.05
|
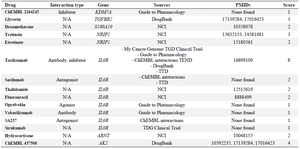
Table 8. Results of the analysis of common DEGs in MS and targeted drugs using DGIdb v3.0
|
|