Methylation of TGM-3 Promoter and Its Association with Oral Squamous Cell Carcinoma (OSCC)
-
Shojaeian, Sorour
-
Department of Biochemistry, Alborz University of Medical Sciences, Karaj, Iran
-
Allameh, Abdolamir
-
epartment of Clinical Biochemistry, Faculty of Medical Sciences, Tarbiat Modares University, Tehran, Iran
-
Garajei, Ata
-
Department of Oral and Maxillofacial Surgery, Faculty of Dentistry, Tehran University of Medical Sciences, Tehran, Iran
-
Department of Head and Neck Surgical Oncology and Reconstructive Surgery, The Cancer Institute, Faculty of Medicine, Tehran University of Medical Sciences, Tehran, Iran
-
Kazemnejad, Anoshirvan
-
Department of Bio-statistics, Faculty of Medical Sciences, Tarbiat Modares University, Tehran, Iran
-
Kabir, Kourosh
-
Department of Community Medicine, Alborz University of Medical Sciences, Karaj, Iran
-
 Zarnani, Amir-Hassan
Department of Immunology, Faculty of Public Health, Tehran University of Medical Sciences, Tehran, Iran, Tel: +98 21 88953021, E-mail: zarnania@tums.ac.ir, zarnania@gmail.com
Zarnani, Amir-Hassan
Department of Immunology, Faculty of Public Health, Tehran University of Medical Sciences, Tehran, Iran, Tel: +98 21 88953021, E-mail: zarnania@tums.ac.ir, zarnania@gmail.com
-
Department of Immunology, Faculty of Public Health, Tehran University of Medical Sciences, Tehran, Iran
-
Reproductive Immunology Research Center, Avicenna Research Institute, ACECR, Tehran, Iran
Abstract: Background: Oral Squamous Cell Carcinoma (OSCC) is among the ten most common cancers worldwide. Hypermethylation of CpG sites in the promoter region and subsequent down-regulation of a tumor suppressor gene, TGM-3 has been proposed to be linked to different types of human cancers including OSCC. In this study, methylation status of CpG sites in the promoter region of TGM-3 has been evaluated in a cohort of patients with OSCC compared to normal controls.
Methods: Forty fresh tissue samples were obtained from newly diagnosed OSCC patients and normal individuals referred to dentistry clinic for tooth extraction. DNA was extracted, bisulfite conversion was performed and it was subjected to PCR using bisulfite-sequencing PCR (BSP) primers. Prepared samples were sequenced on a DNA analyzer with both forward and reverse primers of the region of interest. The peak height values of cytosine and thymine were calculated and methylation levels for each CpG site within the DNA sequence was quantified.
Results: Quantitative DNA methylation analyses in CpG islands revealed that it was significantly higher in OSCC patients compared to controls. DNA methylation at CpG1/CpG3/CpG5 (p=0.004-0.01) and CpG1/CpG3 (p=0.001-0.019) sites was associated with tumor stage and grade, respectively. Male OSCC patients had higher methylation rate at CpG3 (p=0.032), while smoker patients showed higher methylation rate at CpG6 (p=0.045).
Conclusion: These results manifested the contribution of DNA methylation of TGM-3 in OSCC and its potential association with clinico-pathologic parameters in OSCC.
Introduction :
Oral Squamous Cell Carcinoma (OSCC), a subgroup of Head and Neck Squamous Cell Carcinomas (HNSCCs), is among the ten most common types of cancer in the world 1. Globally, OSCC is a public health problem and is strongly associated with alcohol consumption and smoking habit 2. OSCC is considered to be one of the most aggressive and metastatic types of HNSCC with a propensity for rapid local invasion and spread 3. Although the oral cavity is accessible for clinical examination, OSCC has poor prognosis and is usually diagnosed in advanced stages of the disease 2,4 leading to low survival rate due to treatment resistance and tumor recurrence 4-6. Furthermore, recent studies have reported an increased incidence of OSCC among the young and middle-aged individuals 7-9.
Transglutaminases (TGMs) are a widely distributed family of calcium-dependent enzymes catalyzing the post-translational modification of proteins by the iso peptide bonds formation 10. TGM-3, as an epidermal type transglutaminase, is expressed mainly in the suprabasal layers of the stratified squamous epithelium 11. TGM-3 catalyzes crosslinking of various structural proteins for epidermal terminal differentiation and formation of the cornified cell envelope 12,13. Some studies have revealed that down-regulation of the TGM-3 gene is closely related to different types of human cancers, including laryngeal carcinoma 14,15, esophageal cancer 16,17, OSCC 18-20, and cutaneous basal cell carcinoma 21,22. Mendez et al reported that the TGM-3 gene was differentially expressed in node-negative and node-positive primary OSCC tumors 23. However, the role of TGM-3 down-expression on OSCC metastasis is still not well elucidated. In addition, a positive correlation between TGM-3 expression and a good response to chemo-radiotherapy and also better overall survival was observed in OSCC patients 24. However, the effective molecular mechanisms in down-regulation of TGM-3 have not been fully clarified. Gene expression can be regulated via epigenetic DNA modification. Negishi et al studied TGM-3 gene hypermethylation of CpG islands (CpGIs) in 12 OSCC cell lines. They showed hypermethylation of TGM-3 gene promoter was associated with TGM-3 down-regulation. These findings suggest that epigenetic silencing of TGM-3 plays an essential role in the process of oral carcinogenesis 18. Wu et al studied hypermethylation of TGM-3 gene in CpGIs in 9 OSCC cell lines and 7 HNSCC tumor tissues compared with the normal epithelial cells and paired adjacent normal tissues. They found hypermethylation of TGM-3 promoter was one of the mechanisms contributing to the silencing of the TGM-3 gene in HNSCC 19.
In this study, an attempt was made to determine the association of TGM-3 gene methylation in CpGIs, as a mechanism contributing to the gene silencing with OSCC. Direct bisulfite-PCR sequencing was used for quantification of CpG methylation 25. Moreover, the correlation between the methylation of TGM-3 gene in CpGIs and gender, smoking habit and clinico-pathological indices was explored in patients with OSCC.
Materials and Methods :
Patients and specimens: In this study, 40 patients diagnosed with OSCC were enrolled. All patients were candidates of tumor surgery referred to Cancer Institute, Imam Khomeini Hospital, Tehran, Iran during January 2013 to September 2015. All patients were confirmed to have OSCC based on histological examination by pathologists. Patients who had received preoperative immunotherapy, radiation, or chemotherapy were excluded from the study. The control group (n=40) included apparently healthy individuals that referred to dentistry clinic for tooth extraction. Individuals with severe oral infection signs were excluded from the study. Fresh samples were obtained from newly diagnosed patients with OSCC that underwent initial surgical treatment. Half of each sample was embedded in paraffin for pathologic examination, and the rest was quickly transferred and kept in tubes containing RNA later buffer and then frozen at -70°C until DNA extraction. Demographic, clinico-pathological and smoking habit data are shown in table 1. In this study, samples from each patient were stained with Hematoxylin and Eosin (H&E), classified histologically, and staged according to the TNM classification system of the International Union Against Cancer (1988) prior to further analysis. Written informed consent for the use of sample tissues was obtained from all patients and healthy cases before the operation. This study was approved by the Medical Ethical Committee of Alborz University of Medical Sciences (bzums.rec.1394.42).
DNA isolation technique: DNA extraction was performed based on the classic phenol-chloroform extraction method with some modifications 26,27. Briefly, 20 mg of the tissue sample was homogenized in 400 μl of lysis buffer (10 mM NaCl, 20 mM Tris-HCl, 1 mM EDTA, pH=8), 50 μl of 10% SDS, and 25 μl of proteinase k (10 mg/ml). The mixture was heated at 55ºC for 30 min. Next, 400 μl of phenol-chloroform-isoamyl alcohol (25:24:1) was added and incubated for 30 s at room temperature. Then, after centrifugation (7000 rpm for 5 min), 500 μl of the aqueous layer, containing the target DNA, was transferred to a microfuge tube. To precipitate DNA, 50 μl of sodium acetate (3 M, pH=5.2) and 800 μl of ice‐cold isopropanol were added to each tube and incubated at 4ºC for 1 hr. After centrifugation (12000 rpm, 3 min), the supernatant was removed, and 800 μl of ice-cold 70% ethanol was poured into the tube and centrifuged at 12000 rpm for 4 min at 4ºC. The procedure was repeated twice. The supernatant was completely discarded and pellet was subsequently dried by air drying until no visible liquid remained. Finally, to dissolve pellet, 100 μl of distilled water was added to each tube, followed by incubation at 50ºC for 2 min.
Determination of quality and quantity of isolated DNA: DNA quantity (Concentration and extraction efficiency) and quality (Purity and intactness) were analyzed by UV spectroscopy and agarose gel electrophoresis, respectively. For UV spectrophotometric study, the sample’s absorbance spectrum ,between 200 and 320 nm, was measured using a Nanodrop 2000C spectrophotometer (Thermo Scientific, Wilmington, DE, USA), and A260/A280 and A260/A230 ratios were calculated 28. To determine the quality of extracted DNA, electrophoresis was performed on 1% agarose gel with a100-2000 bp ladder.
Bisulfite conversion: For methylation analyses, purified genomic DNA was modified by treatment with sodium bisulfite, which converts all unmethylated cytosines to uracil, and then to thymidine during the subsequent PCR 29; however, the methylated cytosine was left unchanged. Bisulfite conversion was performed using EpiJET™ Bisulfite Conversion Kit (Thermo Fisher Scientific, Waltham, MA) according to the manufacturer’s protocols. Briefly, 200-500 ng of purified DNA in 20 µl of distilled water was incubated with 120 µl of bisulfite solution at 98ºC for 10 min and then 60ºC for 150 min in a thermal cycler. Following thermal cycling to perform the bisulfite conversion, the sulfonated DNA was immobilized by binding to a mini-column and washed to remove bisulfite solution and other impurities due to bisulfite treatment. Also, EpiJET™ Bisulfite Kit was used for desulfonation with NaOH at alkaline pH to convert cytosine to uracil on-column for 20 min at room temperature. The bisulfite converted DNA was purified and eluted for downstream PCR. The samples could be stored at 4°C for 24 hr or -20°C for at least one year.
Primer designing for methylation analysis: To design primers specific for bisulfite sequencing PCR, TGM-3 gene sequence analysis was performed by CLC Genomics Workbench software version 3.6.5 using the TGM-3 reference sequence (NM_005228.3, National Center for Biotechnology Information) to detect the start codon in TGM-3 gene (AUG). Then, up to 10,000 bps upstream of the start codon was selected to search the putative CpGIs in the regulatory region of the TGM-3 gene using MethPrimer online software (found at http://www.urogene.org/methprimer/index1. html) to determine the presence and location of CpGIs within the TGM-3 promoter. Following bisulfite treatment of DNA, PCR was performed with designed bisulfite-compatible primers which targeted the identified CpGI in TGM-3 promoter. The primer sequences were as follows: Forward primer: 5′-GTTTAGGTTGG AGTGTAGTGATG-3′, and Reverse primer: 5′-TCA CTTAAAACCAAAAATTCAAAAC-3′.
Bisulfite sequencing PCR: To quantify the percentage of methylated cytosine in individual CpG sites, BSP amplification of the TGM-3 promoter was done by PCR reaction with Hot Star Taq Master Mix (Ampliqon, Herlev, Denmark). The PCR reaction mixture contained 2 μl of bisulfite-treated DNA sample, 10 μl of Hot Start 2× master mix RED (Ampliqon, Herlev, Denmark), and 500 nmol of each primer in a final volume of 20 μl. The PCR protocol involved preheating at 95°C for 15 min, followed by 30 cycles of amplification in a thermal cycler (MyCycler, Biorad, USA). Each cycle of PCR included a template denaturation step at 95°C for 30 s, primer annealing step at 62°C for 40 s, and chain elongation step at 72°C for 30 s, followed by a final elongation step at 72°C for 10 min.
Verification and purification of PCR product: The size of the amplicon resulting from PCR amplification was verified prior to ensuring the correct size by electrophoresis on a 2% agarose gel and DNA fragments were visualized by gel red (Biotium, UK). PCR products were then purified to remove any unwanted salts as well as remaining primers and free nucleotides from the PCR products that might interfere with the outcome of sequencing results based on binding to the silica SV membrane using ExpinTM PCR SV Kit (GeneAll, Korea) in accordance with the manufacturer’s protocol. Briefly, 5 volumes of binding buffer (PB buffer), containing chaotropes, was added to the PCR product and mixed well. The sample mixture was transferred to the SV column and centrifuged (12,000 rpm for 30 s); then, 700 ul of washing buffer (NW buffer), containing ethanol, was added to the SV column and centrifuged again (12,000 rpm for 30 s). To complete removal of ethanol, the SV column was centrifuged for an additional 1 min and 50 μl of elution buffer (EB buffer, 10 mM Tris-HCl, pH=8.5) was added to the membrane center of the SV column and remained for 1 min at room temperature and then, centrifuged at 12,000 rpm for 1 min to elute the DNA. The eluted DNA was stored at -20ºC until delivery for sequencing.
Direct PCR sequencing and data interpretation: Prepared samples were sequenced in triplicate by Applied Biosystems 3500 DNA Analyzer. Samples were sequenced with the forward and reverse primers of the region of interest. Sequenced samples from the ABI 3500 DNA Analyzer were returned as AB1 files. The sequencing results were compared with the respective reference genomic DNA sequences of TGM-3 gene to determine the CpG site using CLC genomic workbench software and then were analyzed using Chromas software (For PC, available at http://www. technelysium.com.au/chromas.html). Methylation levels for each CpG site within the DNA amplicon were quantified by measuring the ratio between peak height values of Cytosine (C) and Thymine (T), through the basic equation for the methylation percentage (C/ (C+T)*100). In our experience, sequencing with the forward primer resulted in a cleaner chromatogram and more consistent analysis of DNA methylation.
Statistical analysis: Data analyses were performed using SPSS software version 16. T test and Chi square were used to compare demographic characteristics between patients and controls. T test was also used to compare mean of methylation level between patients and controls. p-values less than 0.05 were considered statistically significant.
Results :
Patient clinico-pathological data: A total of 40 OSCC cases and 40 control subjects were included in the study. The histology of OSCC was confirmed by pathological examinations. Tumor site was different in the oral cavity of the patients with tongue carcinoma as predominant oral cancer which comprised 37.5% of the cases. Among these (cases and controls), 42.5% were women and 57.5% were men. The patient group consisted of 40% of women and 60% of men, 65% of whom were smokers. The control group consisted of 45% of women and 55% of men, 47.5% of whom were smokers (Table 1). Tumor grade in majority of patients was well differentiated. Tongue and lips were found to be the most and less prevalent sites for tumor development, respectively.
Evaluation of the quality and quantity of extracted DNA: The yield of purified DNA was within the range of 100-400 ng/µl. Contamination of extracted DNA with proteins and/or residual impurities such as phenol or ethanol usually resulted in reduced ratios of A260/280 and A260/230, respectively. The ratios of A260/280 and A260/230 were 1.7-1.9 and 2-2.1, respectively. According to the expected range of relevant OD ratios, the extracted DNA was of satisfactory purity 29,30. The data described above provide information about the approximate yield and purity of the isolated DNA, but not about the potential fragmentation occurring during the DNA extraction. The integrity of all genomic DNA extracted from samples was investigated by electrophoresis on 1% agarose gel 29. The presence of bands with high intensity and molecular weight indicated high integrity and non-degradation during the extraction process in the tissue samples (Figure 1A).
Identification of CpG islands in TGM-3 promoter: A CpGI located at -6778 to -6578 bp (Including 9 CpG sites) relative to the transcriptional start site of TGM-3 promoter was identified. Of the nine detected CpG sites, methylation status of the six CpG sites was assessed using designed Bisulfite Sequencing PCR (BSP) primers (Table 2).
Verification and purification of bisulfite-treated DNA: The size of the amplicon resulting from PCR amplification was verified prior to ensuring the correct size by electrophoresis. One strong band with the anticipated product size (201 bps) was presented. Samples containing several bands or primer dimers were excluded and re-processed (Figure 1B).
Comparison of methylation of TGM-3 promoter at CpG sites in OSCC patients and controls: Methylation status of TGM-3 promoter at CpGs 1-6 was evaluated using designed BSP primers. It was found that among six CpG sites of TGM-3, all CpGs except CpG3 exhibited significantly greater methylation levels in tumor tissue compared to normal tissue while methylation levels across CpG3 did not show a significant difference between tumor tissue and normal tissue. In this respect, the higher and lower levels of difference in methylation were identified at CpG4 (1.99%, p<0.001) and CpG6 (1.17%, p=0.004), respectively (Table 3, Figure 2). Furthermore, the methylation status in relation to the gender was evaluated. These results indicated gender-dependent hypermethylation at CpG3 (1.22%, p= 0.032) of TGM-3 promoter in OSCC patients (Figure 3).
Cytosine methylation analysis was performed between smoking and non-smoking groups. Based on our results, smoking habit had a positive association with TGM-3 hypermethylation of CpG6 in patients. Indeed, CpG6 exhibited significantly higher methylation level (2%, p=0.045) in tumors of smokers compared to non-smokers (Figure 4).
Comparison of TGM-3 promoter methylation and pathological grade/stage: The association of TGM-3 methylation in relation to clinico-pathological parameters was assessed. It was found that increased TGM-3 methylation level correlated with the pathological differentiation and stage of the tumors. The rate of TGM-3 promoter methylation in CpG1 (1.27%, p=0.019) and CpG3 (1.32%, p=0.001) was significantly higher in Moderately/Poorly Differentiated (MD/PD) compared to Well Differentiated (WD) tumors. Furthermore, correlation between hyper-methylation and tumor stage was confirmed to be significant at CpG1 (1.3%, p=0.02), CpG3 (1.3%, p= 0.004) and CpG5 (1.34%, p=0.01) at stage III/IV compared to stage I/II (Tables 4 and 5, Figure 5).
Discussion :
TGM-3 down-regulation was closely related to a variety of human cancers including Head and Neck Cancers (HNCs) 19,30 such as OSCC 20 and laryngeal carcinoma 15, Esophageal Squamous Cell Carcinoma (ESCC) 16,17, Colorectal Cancer (CRC) 31, and skin cancer 21,22. Although TGM-3 down-regulation has been found in many cancers, the molecular mechanism that causes the silencing of TGM-3 expression in most cancers remains unclear. One of the most important epigenetic modifications which usually results in transcriptional inactivation of the genes is gene promoter hypermethylation. In this study, DNA methylation of TGM-3 promoter gene was evaluated in OSCC patients by direct bisulfite sequencing. To the best of our knowledge, this is the first study investigating the association between DNA methylation in the promoter of the TGM-3 gene and OSCC.
To evaluate the DNA methylation of TGM-3 gene in patients with OSCC, purified genomic DNA from 40 oral cavity tissues and 40 normal tissues were modified by sodium bisulfite treatment. Then, methylation of six CpG sites in a CpG-rich region from -6778 to -6578 upstream of the transcription start site of TGM-3 gene was analyzed by direct bisulfite sequencing. Our results showed significantly higher ratios of methylation levels for TGM-3 promoter at five CpG sites (1-2 and 4-6) in OSCC samples compared with control, while methylation level across CpG3 site was not significantly different between patients and controls. TGM-3 gene methylation status was first evaluated by Negishi et al in 12 OSCC cell lines by cloning and sequencing 18. They showed that of 22 CpG sites in a CpG-rich region, methylation of 8 CpG sites was correlated with TGM-3 silencing. In another study, Wu et al evaluated TGM-3 gene hypermethylation in 9 HNSCC cell lines and 7 HNSCC tissue samples by cloning and sequencing. The results showed that methylation of TGM-3 promoter in the CpG-rich region was correlated with TGM-3 silencing in the HNSCC cell lines. Moreover, the methylation levels of the CpG islands were significantly higher in HNSCC samples than in the paired adjacent normal tissues 19. Our finding reflected a correlation between methylation status of TGM-3 promoter and OSCC. It is possible that the CpG-rich region of TGM-3 promoter functions as a distal enhancer for TGM-3 transcription. It is important to note that even single CpG methylation changes are sufficient to epigenetically alter the expression of a gene 32-35.
Next, the association between TGM-3 promoter methylation and pathological parameters was compared in OSCC patients. Our finding revealed a significant association between hypermethylation of TGM-3 promoter with poorer pathological tumor differentiation and tumor stage. Previous findings demonstrated that DNA methylation biomarkers would improve diagnosis and prognostic accuracy beyond standard staging and grading in ovarian and lung cancers 36-38. Uemura et al established TGM-3 as a novel prognostic biomarker in esophageal cancer for the first time. They demonstrated that the prognostic value of TGM-3 expression was higher than those of the lymph node metastasis, vascular invasion status, and intramural metastasis. Accordingly, examination of TGM-3 expression may provide novel therapeutic strategies to prevent the recurrence of ESCC 16. Also, Wu et al revealed that there was a positive association between TGM-3 expression and pathological differentiation of HNSCC whereas no significant association was determined between TGM-3 expression pattern and tumor stage 19.
The correlation between methylation status of TGM-3 promoter with gender and smoking habit was examined in this study as well. Our results showed a significant relation between methylation level of TGM-3 promoter with gender and smoking habit. For gender-related DNA methylation, several reports demonstrated the correlation between gender and gene methylation in such cancers as gastric 39, colorectal 40, and lung cancers 41-44. This could be influenced by sex hormones or physiological differences between the target organs. Also, some studies have reported an association between DNA methylation and smoking in lung 41,42, bladder 45, and prostate 46 cancers. The specific mechanisms of how smoking may alter DNA methylation are higher level of DNA methyltransferases (DNMT) expression in smokers and HIF-1α-dependent up-regulation of methionine adenosyltransferase induced by hypoxia. The latter enzyme synthesizes S-adenosyl methionine, a major biological methyl donor critical for DNA methylation processes 47,48. However, a study performed by Wu et al showed that there were no significant differences between TGM-3 mRNA expression pattern and gender or smoking in HNSCC 19.
It should be noted that methylation status is not always associated with a low level of gene expression in the tumors. Also, it is likely that other molecular mechanisms, in addition to promoter methylation, influence gene expression 49,50. Therefore, it is better to combine DNA methylation and gene expression data to characterize changes that occur in tumors.
Conclusion :
In conclusion, our results proved an association between TGM-3 hypermethylation and OSCC and this event is associated with less cancer cell differentiation and higher stages. DNA methylation pattern could be regarded as a complementary approach for diagnosis and characterization of tumors. Some biological factors such as gender and individual habits like smoking could result in alteration in DNA methylation patterns.
Acknowledgement :
The authors are very thankful to Alborz University of Medical Sciences as the funder of the project and Tarbiat Modares University as the provider of laboratory facilities.
Conflict of Interest :
The authors declare that they have no conflict of interest.
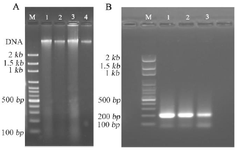
Figure 1. Examining the quality of DNA and bisulfite-treated DNA amplicons. Quality of DNA was evaluated for extracted DNA (A) and bisulfite-treated DNA amplicons (B) using agarose gel (1% and 2%, respectively) electrophoresis and staining with gel red dye. (A): A single, high molecular weight DNA band was detected with no evidence of shearing and RNA contamination (Lanes 1–4). M: 100 bp DNA ladder marker. (B): The DNA amplicons were detected as a single DNA band related to TGM-3 gene amplification, comparable to 200 bp band (Lanes 1–3). M: 100 bp DNA ladder marker.
|
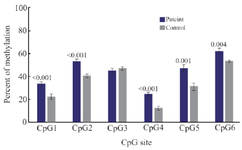
Figure 2. Comparison of methylation of CpG sites in TGM-3 promoter between OSCC and control groups. Methylation of cytosine at CpG1 to CpG6 sites was assessed using BSP amplification. The results revealed significant higher methylation at five CpG sites in OSCC patients compared to control group. p<0.05 was considered statistically significant.
|
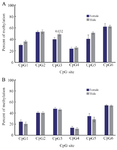
Figure 3. Comparison of gender-dependent TGM-3 promoter methylation in patients and control groups. The assessment of relation between methylation status and gender in patients (A) and controls (B) revealed that there was only a significant difference in methylation level of CpG3 site in patients. p<0.05 was considered statistically significant.
|
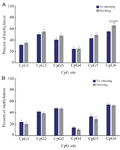
Figure 4. Comparison of the effect of smoking habit on TGM-3 promoter methylation in patient and control groups. Analysis of BSP amplification of the TGM-3 promoter methylation in patient (A) and control (B) groups showed that there was a significant difference related to smoking habit and methylation level of CpG6 site in patients. p<0.05 was considered statistically significant.
|
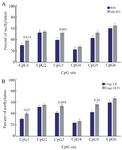
Figure 5. Comparison of grade- and stage-dependent TGM-3 promoter methylation in patients. Analysis of BSP amplification of the TGM-3 promoter showed that there was a statistically significant difference in (A) methylation level of CpG1 and CpG3 in moderately/poorly differentiated (MD/PD) and well differentiated (WD) tumor grades and (B) methylation level of CpG1, CpG3 and CpG5 in tumor stage III/IV and stage I/II patients. p<0.05 was considered statistically significant
|
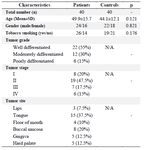
Table 1. Demographic/clinico-pathologic characteristics and smoking status among patients and controls
|
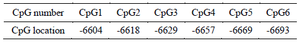
Table 2. Genomic position of assessed CpG sites of regulatory region of TGM-3 gene
|
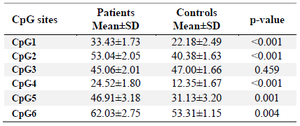
Table 3. Comparison of methylation of CpG sites in TGM-3 promoter between OSCC and control groups
* p-value less than 0.05 was considered statistically significant.
|
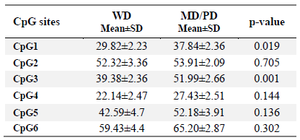
Table 4. Comparison of grade-dependent TGM-3 promoter methylation in patients
p-value less than 0.05 was considered statistically significant. WD: Well Differentiated, MD: Moderately Differentiated, PD: Poorly Differentiated.
|
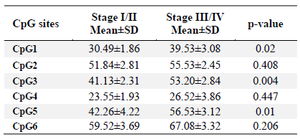
Table 5. Comparison of stage-dependent TGM-3 promoter methylation in patients
p-value less than 0.05 was considered statistically significant.
|
|