Induction of Apoptosis by Green Synthesized Gold Nanoparticles Through Activation of Caspase-3 and 9 in Human Cervical Cancer Cells
-
 Baharara, Javad
Animal Developmental Biology, Research Center for Animal Development Applied Biology and Department of Biology, Mashhad Branch, Islamic Azad University, Tel: +98 511 8437092, E-mail: baharara@mshdiau.ac.ir
Baharara, Javad
Animal Developmental Biology, Research Center for Animal Development Applied Biology and Department of Biology, Mashhad Branch, Islamic Azad University, Tel: +98 511 8437092, E-mail: baharara@mshdiau.ac.ir
-
Animal Developmental Biology, Research Center for Animal Development Applied Biology and Department of Biology, Mashhad Branch, Islamic Azad University, Mashhad, Iran
-
Ramezani, Tayebe
-
Department of Animal Biology, Faculty of Biological Sciences, Kharazmi University, Tehran, Iran
-
Divsalar, Adeleh
-
Department of Cell and Molecular Biology, Faculty of Biological Sciences, Kharazmi University, Tehran, Iran
-
Mousavi, Marzieh
-
Animal Developmental Biology, Research Center for Animal Development Applied Biology and Department of Biology, Mashhad Branch, Islamic Azad University, Mashhad, Iran
-
Seyedarabi, Arefeh
-
Institute of Biochemistry and Biophysics, University of Tehran, Tehran, Iran
Abstract: Background: Gold Nanoparticles (GNPs) are used in imaging and molecular diagnostic applications. As the development of a novel approach in the green synthesis of metal nanoparticles is of great importance and a necessity, a simple and safe method for the synthesis of GNPs using plant extracts of Zataria multiflora leaves was applied in this study and the results on GNPs’ anticancer activity against HeLa cells were reported.
Methods: The GNPs were characterized by UV-visible spectroscopy, FTIR, TEM, DLS and Zeta-potential measurements. In addition, the cellular up-take of nanoparticles was investigated using Dark Field Microscopy (DFM). Induction of apoptosis by high dose of GNPs in HeLa cells was assessed by MTT assay, Acridin orange, DAPI staining, Annexin V/PI double-labeling flow cytometry and caspase activity assay.
Results: UV-visible spectroscopy results showed a surface plasmon resonance band for GNPs at 530 nm. FTIR results demonstrated an interaction between plant extract and nanoparticles. TEM images revealed different shapes for GNPs and DLS results indicated that the GNPs range in size from 10 to 42 nm. The Zeta potential values of the synthesized GNPs were between 30 to 50 Mev, indicating the formation of stable particles. As evidenced by MTT assay, GNPs inhibit proliferation of HeLa cells in dose- dependent GNPs and cytotoxicity of GNPs in Bone Marrow Mesenchymal Stem Cell (BMSCs) was lower than cancerous cells. At nontoxic concentrations, the cellular up-take of the nanoparticles took place. Acridin orange and DAPI staining showed morphological changes in the cell’s nucleus due to apoptosis. Finally, caspase activity assay demonstrated HeLa cell’s apoptosis through caspase activation.
Conclusion: The results showed that GNPs have the ability to induce apoptosis in HeLa cells.
Introduction :
The unique physicochemical properties of nanoparticles made them promising substrates for the development of applications which cover a vast and diverse array of areas including engineering, biology, physics and chemistry 1. Gold Nanoparticles (GNPs) are amongst one of the most extensively studied areas since the first report of gold colloids by Faraday dates back to more than 100 years ago 2. GNPs can be used to label DNA or protein for detection of biological targets with enhanced sensitivity. They are primarily used in imaging, and molecular diagnostic applications 3. Biocompatibility, toxicity and the ability to penetrate cells are three certain factors that will determine the application of a nano product in medicine 4. However, most of the synthetic systems recorded to date rely heavily on toxic reducing agents like sodium borohydride and organic solvents such as N, N-dimethylformamide, which lead to serious environmental issues for vast synthesis. Hence, there is a growing need to develop environmentally safe nanoparticle synthesis processes that do not apply toxic chemicals. Therefore, the biosynthesis technology has received increasing attention because of a cleaner and simpler biosynthesis. The use of environmentally benign materials like plant extracts, fungi and bacteria for the synthesis of nanoparticles, such as GNPs, has increased and attracted attention in recent years 5.
Zataria multiflora (Z. multiflora) referred as "Avishen-e- Shirazi" (in Persian), is a famous traditional Iranian medicine. Z. multiflora is a member of the Lamiaceae family and used in traditional folk remedies for its antiseptic, analgesic and carminative properties 6,7. The main constituents of this plant are phenolic compounds such as carvacrol, thymol and eugenol that have antibacterial effects 8. This plant grows in the south of Iran, Pakistan, India, and Afghanistan. The leaves of Z. multiflora were used in the food industry as a preservative and also for its flavor 6.
Since cancer remains one of the world's most devastating diseases and current cancer treatments include surgical intervention, chemotherapeutic drugs and radiation, which often also kill healthy cells and cause toxicity to the patient 9, the new therapeutic methods should have fewer side effects for cancer patients. Gold nanoparticles are widely investigated for biological applications and medical purposes due to their unique optical properties and electrochemical stability 10. Therefore, in the present study, gold nanoparticles were synthesized using medical plant of Z. multiflora extract, and then the apoptotic effects of capped GNPs with medical plant extract against cervical carcinoma HeLa cells were studied. In fact, gold nanoparticles also act as a carrier for Z. multiflora extract. This plant extract was also reported to have antioxidant and anticancer effects 8.
Materials and Methods :
Chemicals: HAuCl4-•3H2O, RPMI, 3-(4,5-dimethylthiazol-2-yl)-2,5-diphenyltetrazolium bromide, yellow tetrazole (MTT), penicillin-streptomycin, DAPI (4_,6-diamidino-2-phenylindole, dihydrochloride), ethidium bromide and Acridine orange were all purchased from Sigma-Aldrich. Annexin-V-FITC was purchased from abcam. Z. multiflora leaves were collected from local natural sources (Khorasan province, Mashhad). HeLa cells were obtained from the National Cell Bank of Iran (NCBI)-Pasteur Institute of Iran and BMSCs were obtained from rat bone marrow. All solutions were prepared with double distilled water.
Plant extract preparation: Z. multiflora leaves were collected from Shiraz, Iran in May. The identity of the plant material was confirmed by a plant taxonomist from the Herbarium Division of the Ferdowsi University with the voucher specimen number 34516. The leaves were then washed thoroughly 3 times with double distilled water, and air-dried in the shade at room temperature for a week, powdered in a mixer. Following this step, 5 g of the powdered leaves was added to 100 ml of sterile distilled water in a 500 ml Erlenmeyer flask and boiled for 5 min. The extract was then filtered through a Whatman filter (paper No.1). The solution was then stored at 4°C for further use.
Synthesis of gold nanoparticles and characterization techniques: In a typical experiment, the leave extract (0.1 up to 1 ml) was added to 10 ml of 1 mM chloroauric acid (HAuCl4) aqueous solution. Change in the color of the solution indicates the formation of the nanoparticles. This process was carried out at room temperature and at pH=7.
After the addition of the gold salt solution to the plant extract, the color of the solution was changed from colorless to ruby red indicating the formation of GNPs. UV–visible absorption spectra of AgNPs were measured at the wavelength of 300-700 nm using a spectrophotometer (Biotake, Epuch, US). The average size of the nanoparticles was determined using DLS (Cordovan, Vaso particle, France). The sample with the best UV-visible peak was selected for the DLS study. DLS was used to determine the size distribution profile of GNPs at 25oC using 0.894 cp for the viscosity of the medium, a fixed angle of 90oC for the Avalanche Photo Diode (APD) detector and a wavelength of 657 nm for the 50 mW laser. Stability of the nanoparticles was determined using Zeta potential analysis. Zeta-potentials of GNPs in water were evaluated using CAD (Zeta compact zeta sizer, France). Samples were sonicated for 5 min before measurements in order to ensure that the particles were well dispersed and the dispersion was homogeneous. The morphology and size of the GNPs were investigated by TEM images (CM 30, Philips, Windhaven, and T Netherlands). For imaging, thin films of the samples were prepared on a carbon coated copper grid by just dropping a very small amount of the samples on the grid and allowing it to dry in a desiccator at room temperature. Grids were viewed using a transmission electron microscopy. FTIR for plant leave extract and GNPs was obtained in the range of 4,000 to 400 cm−1 with a Perkin Elmer spectrophotometer paragon 1000. In order to remove any free biomass residue or unbound extract from the surfaces of the GNPs, the GNPs were repeatedly washed with distilled water. Subsequently, the product was centrifuged at 9000 rpm for 10 min and dried. The powdered GNPs were mixed with KBr powder and FTIR spectra were obtained in the range of 4,000 to 400 cm−1.
Cell culture: The human tumor cell line (HeLa) and BMSCs were selected for the cytotoxicity study of GNPs. Cells were grown in RPMI. This medium was supplemented with 10% FBS and 1% penicillin-streptomycin (Sigma) at 37oC under a 5% CO2/ 95% air atmosphere.
In vitro cytotoxicity study and cellular uptake: The in vitro cytotoxicity of GNPs in HeLa cells and BMSCs (as normal cells) was studied using the MTT assay. The cleavage and the conversion of the soluble yellowish MTT (sigma) to the insoluble purple formazan by active mitochondrial dehydrogenase of living cells has been used for the measurement of cell proliferation. Harvested cells were seeded into a 24-well plate (1×10⁵ cell/ml) with different amounts of GNPs (0-400 μg/ml) for 48 hr. At the end of the incubations, 20 µl of MTT solution (5 mg/ml in PBS) was added to each well containing fresh and cultured medium. The insoluble formazan produced was dissolved in a solution containing 1 ml of isopropanol (Merck) and left for 4 hr at room temperature in dark conditions. Finally, the Optical Density (OD) was read against a blank reagent using a well scanning spectrophotometer (Biotek Epoch, US) at 570 nm. The viability of the cells was calculated using the equation below:
Viability of treatment cells (%)=(Atreated/Acontrol)x100
where Atreated and Acontrol are the absorbance of the treated and untreated cells, respectively 4.
Dark field microscopy (DFM): DFM was used to determine the cellular uptake of GNPs. For this reason, the HeLa cells were treated with 80 µg/ml GNPs, based on the MTT results, and after a 48 hr treatment, the cells were analyzed by dark field microscopy (Biomed, Korea).
Acridine orange and ethidium bromide staining: A dye mixture in equal ratios of acridine orange and ethidium bromide was prepared and mixed with the cell suspension solution and placed on a clean microscopic cover slip. After incubation for approximately 2-3 min, cells were visualized under a fluorescence microscope at 40× magnification via an especial filter at 510-590 nm. The percentage of apoptotic cells was calculated using the formula below:
| %apoptotic cells= |
Total number of apoptotic cells |
x 100
|
|
| Total number of normal and apoptotic cells |
DAPI staining: The treated HeLa cells were fixed with a solution of methanol: acetic acid (3:1, v/v) prior to washing with PBS. The washed cells were then dyed with DAPI (4, 6-diamidino-2-phenylindole, dihydrochloride) in the dark. Stained images were captured using a fluorescent microscope with an appropriate filter (Biomed, Korea).
Determination of apoptotic and necrotic cells: The amount of the externalization of phosphatidylserine (PS) from HeLa cell surfaces was determined by the Annexin-V-FITC staining kit (Abcam, Germany) according to the manufacturer’s instructions. The cells were treated with 100 µg/ml for 24 and 48 hr and then harvested and centrifuged at 200xg for 5 min. Subsequently, the cell pellet was resuspended in binding buffer. Following that step, 5 µl of Annexin- V-FITC labeling solution and 5 µl of PI solution were added to the mixture, and incubated for 5 min at 25oC and then analyzed with a flow cytometer (Bd, UK).
Caspase activity assay: A quantitative enzymatic activity assay was carried out according to the instructions of the manufacturer for the colorimetric assay kit (Abcam, Germany). After treatment with GNPs (100 µg/ml for 24 hr), cells were washed, collected, lysed, centrifuged, and analyzed for total protein by the Bradford assay. Samples containing 200 µg of total protein were assayed for caspase-3/9 activity with DEVD-pNA as a caspase-3-specific substrate. Absorbance was measured at 405 nm in a plate reader.
Statistical analysis: Statistical evaluation of the data was performed using a one-way analysis of variance (ANOVA) and a Tukey test was used for multiple comparisons as a posttest with the help of SPSS software. Results were shown as mean±SD and p<0.05 was calculated as the minimum level of significance.
Results :
Synthesis of gold nanoparticles and characterization techniques: The present study reports the green synthesis of GNPs by the reduction of aqueous HAuCl4 using the Z. multiflora leaf extract. The formation of the GNPs could be detected by the change in color of the reactive mixture of gold solution and plant extract. Solutions of colloidal GNPs have a distinctive red color, characteristic of GNP formation due to the excitation of surface plasmon vibrations in GNPs. In the case of the mixture ratio of 10 ml of HAuCl4 and 1 ml of leaf extract (10:1 v/v), changes in the color of the reaction mixture started within 30 min at room temperature. Higher ratios of the mixture, up to 10 ml of plant extract and 10 ml of HAuCl4, did not lead to the formation of nanoparticles. At lower ratios of the mixture, a weak color change was observed. No significant color change was seen in either the control or the sample which only contained the pure aqueous HAuCl4 solution. Results have shown that increasing the amounts of leaf extract leads to a decreased efficiency in nanoparticle synthesis. The color for the extract and AuCl4 combined solution changed to light ruby red within 30 min at room temperature and later changed to dark ruby red during the incubation period (Figure 1). It is well known that the small GNPs exhibit only one Surface Plasmon Resonance (SPR) absorption band. The SPR bands centered between 500-600 nm indicate the formation of GNPs in solution. Therefore, the reduction of gold ions to GNPs was analyzed using UV-visible spectrophotometer in the wavelength range of 300-700 nm at regular time intervals. The maximum absorbance of GNPs was seen at 540 nm (Figure 2A), and the surface plasmon band for GNPs solution remained close to 540 nm throughout the reaction period indicating that the particles were dispersed in the aqueous solution, with no evidence for aggregation. It is notable that the best peak was seen in the ratio of 10 ml of AuCl4 and 1 ml of plant extract (Figure 2B). The use of greater volumes (up to 10 ml) of extract led to the deposition of GNPs and a color change in the solution, which is unfavored. Additionally, the GNPs did not represent any peak in the wavelength range of 300-700 nm. It was also observed that the intensity of the surface plasmon bands increased as the reaction time progressed from 0-4 hr and then remained at a near to constant intensity, indicating the completion of the reaction process (Figure 2A). The nanoparticles were seen to be well-dispersed without the need for any physical and/or chemical capping agents. The synthesized GNPs from leaf extract were observed to be very stable in solution, even after 1 month of synthesis. According to these results, a mixture of 10:0.7 (v/v ratio) of HAuCl4 and leaf extract was selected for further analysis. A sucrose density gradient separation was also performed to improve the monodispersity of GNPs. Figure 3A shows the typical bright-field TEM micrograph of the synthesized GNPs. As shown in figure 3A, GNPs are of different shapes; pentagons (arrow marked 1), larger propensity of triangular nanoparticles (arrow marked 2) and some of undefined shapes (arrow marked 3). Figure 3B shows the size distribution of nanoparticles centered on 10-50 nm, therefore, giving an average diameter of 20.52 nm for the nanoparticles. Additionally, the TEM image shows that all nanoparticles tend to be well separated from each other without the formation of aggregates. DLS results showed that the average diameter of nanoparticles were 21.13 nm and indeed agree with the results obtained from TEM analysis (with a diameter of 20.52 nm) (Figure 4). As taken together, the data showed that the GNPs were small, uniform in size, stable and without any obvious aggregation. The Zeta sizer was used to measure the electrophoretic mobility of each nanoparticle sample. Complex Zeta potential is a parameter which is used in the study of the surface charges and stability of nanoparticles. Surface charges can greatly influence the particle size distribution and the cellular uptake of nanoparticles. In natural conditions (pH close to 7.2), the Zeta potential of the synthesized GNPs was equal to -30 to -50 mV (Figure 5). It could be concluded that GNPs have a negative Zeta potential and the particles are fairly stable due to their electrostatic repulsion (as a rule of thumb, ±30 mV is the required Zeta potential to keep dispersion charge stabilized). FTIR measurements were carried out to identify candidate biomolecules responsible for efficient stabilization and capping of GNPs synthesized using Z. multiflora leaves. Figure 6 shows the FTIR spectrum of synthesized GNPs in this study. The representative spectra of nanoparticles exhibit absorption peaks located at 3388, 2928, 1721, 1075 and 611 cm-1 (Figure 6). The broad band contour which appears in the range of 3000-3400 cm-1 is the summation of intermolecular associations of hydrogen bonds related to -NH2 and -OH groups in the protein molecules. The peaks at 2922 and 2852 cm-1 confirm the presence of the -CH3 (alkanes) groups. The absorption peak at around 1077 cm-1 is attributed to the stretching vibrations of -C=O (ester) groups and the amount of 1721 cm-1 can be attributed to the C=O (ketone and aldehyde) groups. The peak at 605 cm-1 confirms the presence of the C-S stretch in the samples analyzed. The various functional groups mentioned above are mainly derived from Z. multiflora's water soluble components. Therefore, it can be assumed that different water soluble compounds such as alkanoids and flavonoids act as capping ligands for the synthesis of GNPs.
Cytotoxicity study: The potential toxicity of the synthesized GNPs against HeLa carcinoma cells has been examined. The HeLa cells were treated with different concentrations (0-400 µg/ml) of nanoparticles for 48 hr and then MTT assay was used to measure mitochondrial activity in viable cells. As it is shown in figure 7, reduction in cell viability by ~50% (inhibitory concentration=IC50) in comparison with the control was achieved at a dose of 100 µg/ml of GNPs, while the greatest number of cells were killed at 400 µg/ml of GNPs. However, cytotoxicity of GNPs in bone marrow was lower than Hela cells IC50 of GNPs in BMSCs which was 300 µg/ml (Figure 7).
Dark field microscopy study: In this study, DFM was used to determinate the GNPs uptake into HeLa cells. In DFM, the GNPS on the cell surface scatter yellow light due to the enhanced SRP in the visible region after 48 hr. The concentration of GNPs (80 µg/ml) used in this experiment was according to the MTT assay, which was below that of the IC50 value. The results showed that the nanoparticle uptake by the cells may be due to the plant material that covers the surface of the particles (Figure 8). HeLa cells which uptake nanoparticles scatter yellow light due to SRP of GNPs.
DAPI staining results: The next specific aim was to determine whether the cell viability inhibitory effect of GNPs is associated with induction of cell apoptosis. For cells treated with GNPs (0, 100 and 400 µg/ml) for 48 hr, DAPI staining assay revealed that the GNPs caused condensed nuclei and apoptotic bodies in a dose-dependent manner in HeLa cells (Figure 9).
Acridine orange results: Using a fluorescence microscope, Acridine orange staining showed that normal cells appear uniformly green whereas early apoptotic cell debris was yellow or yellowish green. Acridine orange can be used in conjunction with ethidium bromide to differentiate between viable, apoptotic and necrotic cells. Figure 10 shows images of control HeLa cells as well as necrotic
and apoptotic cells after Acridine orange/ethidium bromide staining. Figure 10A shows the control, which did not receive any treatment. The arrows show live cells (green) and figure 10B indicates treated cells with 100 μg/ml GNPs in late apoptotic stage (dead=orange) with condensation and chromatin clumping. Figure 10C shows that 400 μg/ml of GNPs leads to the death of all of the cells (red).
Flow cytometer study: Apoptosis was assessed using dual Annexin-V and PI staining kit. The proportion of cells in the lower-right quadrants, which corresponds to apoptotic cells (Annexin-V positive) increased to 23.2 and 26.4% after treating the HeLa cells with 100 µg/ml of GNPs for 24 and 48 hr, respectively. The proportion of cells in upper and right quadrants of late apoptosis (Annexin-V positive and PI positive) increased to 7.7 and 46.2 after treating the HeLa cells with 100 and 400 µg/ml of GNPs, respectively. These results are all hallmarks of apoptotic cell death and demonstrate the ability of GNPs to induce apoptosis in HeLa cells in a time dependant manner (Figure 11).
Caspase assay results: In this experimental study, caspase activation was evaluated in cells treated with 100 µg/ml of GNPs for 24 hr. Colorimetric assay of caspase-3/9 activity showed that the caspase activity in cells treated with GNPs increased significantly (p>0.05) in comparison to untreated groups. This assay indicated that BV promoted the caspase-3/9 activation in HeLa cells. The activation of caspase-3/9 during GNPs induces apoptosis of HeLa cells through caspase activiation (Table 1), (Figure 12).
Discussion :
One-step green synthesis of GNPs is presented using the biodegradable Z. multiflora extract at room temperature, at neutral pH and without the use of external factors such as shaking. This method is simple, economical, nontoxic and efficient comparing chemical methods. The maximum absorbance of GNPs was seen at 530 nm which is similar to the maximum
absorbance wavelength reported by Chueh et al 4 and Geetha et al 11. Both groups used a green approach for the synthesis of GNPs distinguished with a sharp peak around 540-560 nm 12. TEM image showed that the synthesized GNPs have various morphologies. He et al used chitosan chains for the synthesis of GNPs by a "green" method and their TEM images showed that their nanoparticles had different shapes and the size of their GNPs ranged between 10 and 50 nm 13. In addition, GNPs synthesized using honey showed polymorphology which is in agreement with our results 14. The variety in shape can be due to various herbal ingredients which can give nanoparticles a unique shape. The diameter of the GNPs was 21 nm in average, as shown by DLS. The flavonoid, terpenoid and protein constituents which were presented in Z. multiflora extract are the surface active molecules stabilizing the nanoparticles. As the evidence from measurement of Zeta potential showed, these GNPs were stable. Although the exact mechanism for the formation of GNPs is not understood, however, based on our data and other published results, the following points can be outlined. The Z. multiflora extract is primarily composed of carvacrol and thymol as main phenolic compounds and p-cymene as the main non-phenolic compound, respectively 15. The active constituents of Z. multiflora are thymol and carvacrol giving rise to a variety of beneficial functions including antioxidant, antifungal and antinociceptive activities 16. The antioxidant activity of phenolic compounds is due to their high tendency to chelate metals. Phenols possess hydroxyl and carboxyl groups and are able to bind to heavy metals. In addition, other reports have shown that proteins can bind to nanoparticles through free amine groups and, therefore, the stabilization of GNPs by proteins is a possibility. Therefore, it can be concluded that biological molecules could be involved in both functions of formation and stabilization of GNPs in the aqueous medium 17. GNPs can be utilized in Photo Thermal Therapy (PTT). For example, Xiaohua Huang et al demonstrated that the laser power threshold for the photo thermal destruction of cells after the NPS treatment is found to be 20 times lower than that required to destroy the cells in the normal PTT, that is, without the use of NPS 18. NPs may have the potential to improve local regional control and shorten the period needed for PTT, which may help minimize PTT side effects. According to previous reports, GNPs can act as a drug delivery system such that GNPs can bind drugs after surface modification or by ionic bonding, physical adsorption, or covalent bonding. They have the benefit of stability, high tissue permeability and small size 19. For example, GNPs conjugated with methotrexate are efficient transporters. In this study, the FTIR spectroscopic results confirm that some various functional groups on the surface of GNPs can be used for binding various factors including protein, RNA, DNA and drugs for medical and drug delivery applications. Overall, the up-take of nanoparticles at nontoxic concentrations seems appropriate and it can be concluded that GNPs can be used for various purposes in the field of gene delivery, drug delivery and other therapy approaches such as PTT, without the need for any additional surface modifications. Most studies have used GNPs at low concentrations. Cytotoxic effect of GNPs was also assessed.
The present study shows that high doses of GNPs is cytotoxic for HeLa cells as it reduces cell viability in a concentration dependent manner; however, GNPs have toxic effect on BMSC cells only in higher doses. Moreover, a high dosage of GNPs seem to induce HeLa cell death via apoptosis that was demonstrated by results from the DAPI and Acridine orange staining and Annexin V/PI study. Mytych et al have assessed the cytotoxic effect of GNPs on different mammalian cell lines, including that of PK-15 (porcine kidney), Vero (African green monkey kidney), NIH3T3 (mouse embryonic fibroblast) and MRC5 (human normal lung fibroblast) cells.
They reported that GNPs induce a concentration-dependent suppression of growth in all tested cell lines, although there were different levels of inhibition among cell lines 20. Also Bhowmik et al introduced a simple biosynthetic method using flower extract of Couroupita guianensis to synthesize GNPs and explored the anti-leukemic cancer activity of HL-60 using the synthesized GNPs. Their results indicate that the proliferation of HL-60 cells due to gold nanoparticle treatment effects were dose dependent 21.
Conclusion :
These results confirmed our findings which show that the GNPs can inhibit the cell proliferation in a dose dependent manner and GNPs could induce apoptosis in HeLa cells through caspase activation. Therefore, GNPs not only have the potential for use, either by local application or via intravenous routes as a carrier, also they can be used to induce apoptosis in cancer cells with high doses. In the future, the GNPs alone, or conjugated with specified antibody or anti-cancer drugs, may be applied for the treatment of cervical cancer or other cancers which may overcome adverse effects associated with the chemotherapy and traditional radiation methods.
Acknowledgement :
This study was financially supported by the Research Center for Animal Development Applied Biology, Islamic Azad University, Mashhad branch.
Conflict of Interest :
The authors declare no conflict of interest.
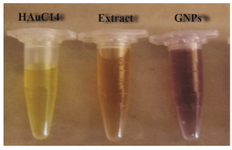
Figure 1. Visual appearance of color change in vials containing the Zataria multiflora leaves extract, AuHCl4 solution and GNPs at room temperature after 4 hr of mixing with AuHcl4.
|
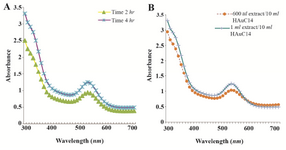
Figure 2. UV-Visible spectra of AgNPs at different time intervals. A) UV-Visible spectra of GNPs at different extract concentrations; B) the sharp peak in 530 nm appeared in UV-Visible spectrum.
|
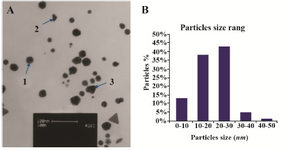
Figure 3. A) Transmission electron microscope images of the green synthesized GNPs; B) Particle size distribution histogram of GNPs determined from TEM image analyzed by the Image J software.
|
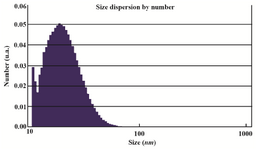
Figure 4. Particle size distribution of synthesized GNPs. The range was from 10-80 nm and average size of nanoparticles was 21.13 nm.
|
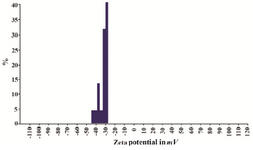
Figure 5. Zeta-potential of synthesized GNPs appeared negative between -20 to -50.
|
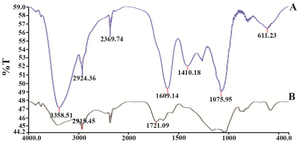
Figure 6. FTIR absorption spectra of dried Zataria multiflora leaf extract before bio reduction; A) and after complete bio reduction; B) at room temperature. These spectra were similar and plant extract covered GNPs.
|
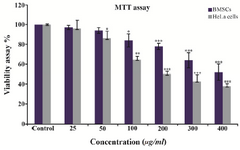
Figure 7. Effects of different concentrations of GNPs on HeLa cells compared to BMSCs viability after 48 hr of treatment. The significant (p<0.05) decrease in cell viability was observed in a dose dependent manner. The values are shown as mean±SD.
|
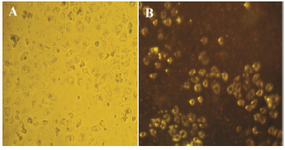
Figure 8. Bright field image of HeLa cancer cells incubated with GNPs. A) Dark-field image of a live cell after treatment (∼48 hr) with GNPs in cancer cells; B) Cell surface scatters yellow light due to the GNPs uptake in the visible region.
|
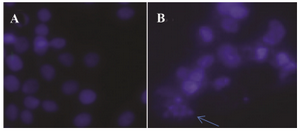
Figure 9. DAPI stained image of HeLa cells after treatment with GNPs. Choromatin fragmentation is shown with arrow.
|
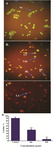
Figure 10. Comparison of EB/AO method for HeLa suspension cells. HeLa cells were treated with A) 0, B) 100 μg/ml and C) 400 μg/ml of GNPs for induction of apoptosis. Representative micro-graphs showing quantification of cells viability after 48 hr of treat-ment with 0, 100 and 400 μg/ml of GNPs D). The cells were introduced as normal cells (NC), early apoptotic cells (EA), late apoptotic (LA) after 48 hr of treatment showing membrane blebbing (BL), chromatin condensation (CC), blebbing and nuclear margination (MN), DNA fragmentation (DF) and apoptotic body formation after 48 hr of treatment using arrows. The values are shown as mean±SD.
|
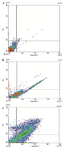
Figure 11. Dot plots of PI versus Annexin V staining followed by flow cytometry analyses for Hela cells at density of 106 cell/ml, based on GNPs induced externalisation of phosphatidylserin. Figures from A-C represent controls of Hela cells without treatment (A) and Hela cells treated with 100 μg/ml (=IC50 value) of GNPs after 24 and 48 hr (B and C, respectively).
|
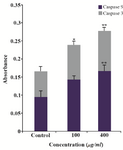
Figure 12. The activity of cellular caspase-3/9 was assayed as described in Materials and Methods. Significant differences (p>0.05) in caspase-3 and caspase-9 activity were found between the treated and control groups.
|
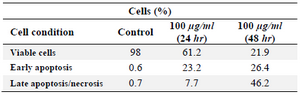
Table 1. Flow cytometric analysis of HeLa cells treated with various concentrations of GNPs after different incubation times
|
|