Quantitative Analysis of ErbB1 and ErbB2 Genes Amplification by a High Performance Liquid Chromatography
-
 Rasti, Mozhgan
Department of Biochemistry, School of Medicine, Shiraz University of Medical Sciences, Shiraz, Iran, Tel/Fax: +98 711 2303029; Email: rasti31@yahoo.com
Rasti, Mozhgan
Department of Biochemistry, School of Medicine, Shiraz University of Medical Sciences, Shiraz, Iran, Tel/Fax: +98 711 2303029; Email: rasti31@yahoo.com
-
Department of Biochemistry, School of Medicine, Shiraz University of Medical Sciences, Shiraz, Iran
-
Honardar, Zohreh
-
Department of Biochemistry, School of Medicine, Shiraz University of Medical Sciences, Shiraz, Iran
-
Nikseresht, Mohsen
-
Department of Biochemistry, School of Medicine, Yasuj University of Medical Sciences, Yasuj, Iran
-
Owji, Aliakbar
-
Department of Biochemistry, School of Medicine, Shiraz University of Medical Sciences, Shiraz, Iran
Abstract: Background: Genes for human epidermal growth factor receptors B1 (ErbB1) and B2 (ErbB2) were amplified in breast and ovarian cancers. Both of them were associated with aggressive disease and worse prognosis. The ErbB1 or ErbB2 status of a tumor may provide an indication of the response to ErbB1 and ErbB2 -targeted therapies. For accurate and rapid assessment of amplification of ErbB1 and ErbB2 oncogenes, a High Performance Liquid Chromatography (HPLC) method was developed in this study. Methods: DNA was extracted from 30 primary breast tumors and 20 blood samples of healthy donors. ErbB1 and ErbB2 genes along with a reference gene were co-amplificated by Polymerase Chain Reaction (PCR). The PCR products were separated and quantified using an anion- exchange column within 30 min and in a single step. Optimum resolution was obtained when a sodium chloride gradient and a column temperature of 35˚C were used. The results of HPLC analysis of ErbB1 and ErbB2 PCR products were compared with real time PCR method as a gold standard test for 7 tumor samples. Results: The proposed HPLC method was confirmed by real time PCR method. Twenty two and ten of the specimens in our breast cancer cohort showed more than a two-fold amplification of ErbB2 and ErbB1 oncogenes, respectively. Conclusion: Our results were confirmed by real time PCR and showed that HPLC method is a specific, cheap and clinically applicable analytical approach for assessment of ErbB1 and ErbB2 statuses in breast tumors.
Introduction :
Human epidermal growth factor receptors B1 (ErbB1) and B2 (ErbB2) are members of the transmembrane receptor tyrosine kinase family 1. ErbB1 through binding by a ligand growth factor undergoes dimerization and generates intracellular signals resulting in cell proliferation, migration and differentiation. ErbB2 binds no ligand, but upon stimulation acts as a co-receptor for another ErbB family member 1. ErbB1 is a prime ErbB2 co-receptor due to its activation in carcinomas 2. Overexpression of ErbB1 and ErbB2 proteins, predominantly through amplification of the genes, has been found in 7-20% and 20-30% of breast cancers, respectively 3-5. In majority of cases, overexpression of ErbB1 and ErbB2 is associated with chemoresistance and poor prognosis in patients with early breast cancer 6,7. ErbB1 and ErbB2 overexpression can prolong the intracellular signaling in breast and other types of tumors which promotes carcinogenesis. It has been shown that ErbB1 plays a similar but not necessarily interdependent role in ErbB2-related breast cancers 2. In addition, ErbB1 and ErbB2 amplification correlates inversely with Estrogen Receptor (ER) status 8,9 and they are often expressed in ER-negative tumors with poor prognosis. Expressions of these markers are of clinical significance. Therefore, these receptors are constantly and intensively pursued as therapeutic targets for breast cancer therapy 5,10,11.
Owing to the clinical relevance of ErbB1 and ErbB2 determination in tumors, different analytical approaches have been developed for measuring ErbB1 and ErbB2 genes amplification in tumors. Methods for quantitative assessment of amplification of these genes are confined to Real Time Polymerase Chain Reaction (RT-PCR) and Fluorescence In Situ Hybridization (FISH). However, these methods are rather expensive and complicated. Semiquantitave methods are based on the use of ErbB1 and ErbB2 antibodies in Immunohistochemical (IHC) protocols 12,13. High Performance Liquid Chromatography (HPLC) methods have been used for separation and rapid quantification of two DNA fragments generated by PCR. Co-amplification of ErbB2 gene and a reference gene by PCR has been used firstly for determination of oncogene amplification through HPLC in 1993 14,15. This PCR method was also used for detection of gene amplification of other Erb oncogenes such as ErbB1 in cancer tissues 16. Application of HPLC methods such as denaturing HPLC was later used as a rapid method for determination of gene copy numbers on X chromosome genes 17. Since HPLC has become a widely accessible and widely used laboratory technique, in this study, a method was developed for quantitative determination of ErbB1 and ErbB2 genes amplification. An optimized PCR procedure and a high performance anion-exchange liquid chromatography were employed in this research. In the present study, the applied PCR-HPLC method was developed and validated for accurate and rapid assessment of the amplification of ErbB1 and ErbB2 oncogenes in primary breast cancers.
Materials and Methods :
Chemicals: Tris, EDTA, NaCl were purchased from Merck, USA.
Samples, cell culture and DNA extraction: A total of 30 primary breast cancer tumors were obtained from the department of pathology at Shiraz University of Medical Sciences in Shiraz. The clinical and histopathological information was obtained by retrospective review of the medical records. All of the samples belonged to the patients who lived in Fars province. DNA was isolated from the frozen tissues by a standard phenol/ chloroform procedure 18.
EDTA-anticoagulated blood samples of 20 healthy donors were obtained from Shiraz University Hospital. The control group was chosen and age matched with patient group. DNA was extracted from 1 ml of blood samples by a DNA extraction kit (Cinnagen, Iran). DNA was also extracted from BT-474 and MCF7 cell lines (Pasture Institute, Iran), used as ErbB2 positive and negative standards, respectively. BT-474 and MCF7 cells were grown in RPMI 1640 (Biosera, UK) supplemented with 2 mM L-glutamine and 10% fetal calf serum (Cinnagen, Iran). All extracted DNAs were saved
at -20°C until analysis. All experiments with human subjects were approved by ethics committee at Shiraz University of Medical Sciences. Participants signed a consent form before the study.
PCR conditions and gel electrophoresis: For detection of ErbB1 and ErbB2 oncogenes amplification, differential PCR was applied 15. In this procedure, each of the target genes and a reference gene were co-amplificated by PCR. The gene for interferon gamma (INFγ) was used as the single copy reference gene. PCR was performed in a total volume of 50 μl containing the PCR buffer, dNTPs (each at 0.2 mM), MgCl2 (1.5 mM), 1.25 units of Taq DNA polymerase, all provided by enzyme supplier (Fermentas, Iran), primers (0.3 μM each per reaction), and DNA (250-500 ng). All specific primers were ordered from Cinnagen, Iran. Sequences of PCR primers that were used to distinguish ErbB1, ErbB2 and INFγ genes, annealing temperatures, and the expected sizes of PCR products are summarized in table 1. Amplification of genes was performed under the following condition: an initial melting step of 95°C for 5 min; and 30 cycles of 95°C for 30 s, specific annealing temperature as listed in table 1 for 30 s, 72°C for 55 s; and a final extension of 10 min at 72°C. A reaction without DNA was used as the negative control reaction for each set of PCR reactions. The amplified products were analyzed by HPLC as well as loaded onto a 2% agarose gel and visualized under UV illumination.
HPLC method: HPLC system which used for analysis of PCR products consisted of a smartline pump 1000, a smartline UV detector 2500 and a smartline manager 5000 (Knauer, Germany) for data handling. The column (Hamilton, USA) was a PRP-X600 weak base anion-exchange, 7 μm particle size and 504.6 mm. The mobile phase was as follows: solvent A was 20 mM Tris, 1 mM EDTA (pH=9) and solvent B was 20 mM Tris, 1 mM EDTA, 1 M NaCl (pH=9). A gradient elution program consisting of linear segments was employed, 50% solvent B for 3 min, 50-100% solvent B for 20 min and 50% solvent B for 10 min. The flow rate was 1 ml/min at 35C. PCR products of control and test samples (80 μl) were diluted 1:3 in water and used for injection. The peak area for amplification of each ErbB1 or ErbB2 and INFγ PCR products was obtained by HPLC in each experiment. ErbB1 and ErbB2 genes amplification of 20 control samples relative to INFγ was firstly determined. Then, the fold amplification for patient samples was calculated using the formula (T ErbB1 or ErbB2 peak area/T INFγ peak area)/Mean of 20 samples (C ErbB1 or ErbB2 peak area/C INFγ peak area) where T and C are the test and control PCR products, respectively. Each experiment was repeated at least twice.
DNA standards: A DNA size marker including 50 bp ladder (13 fragments: 50, 100, 150, 200, 250, 300, 400, 500, 600, 700, 800, 900, 1000) was analyzed under conditions explained for separation of PCR products. The 50 bp ladder was also run on a 2% agarose gel for comparison with chromatographic data.
Real time PCR: ErbB1 and ErbB2 genes amplification for 7 test and one control samples was analyzed by RT-PCR using a BioRad IQ5 RT-PCR system. The PCR reaction mixture contained 3 μl of genomic DNA (100 ng, 5-fold diluted), 1 μl of 5 mmol/l solutions of each of the forward and reverse primers, and 12.5 μl of 2 SYBR green DNA PCR Master Mix (BioRad, USA) in a total volume of 25 μl. PCRs for each primer set were performed in duplicates, and the means were reported. All PCR reaction conditions were as follows: an initial denaturation at 95°C for 5 min and 35 cycles (15 s at 95°C, 30 s at specific annealing temperature as listed in table 1 and 30 s at 72°C). The primer sequences for amplifications are summarized in table 1. The agarose gel (2.0% w/v) electrophoresis and melting curve analysis (Tm) were employed to confirm the specificity of the products. The efficiency of amplifications was measured by the slope of a standard curve, derived from five-fold serial dilutions of human normal genomic DNA. In all cases, the amplification efficiency was between 95 and 105%, respectively. Amplification of ErbB1 and ErbB2 were normalized to INFγ as the single copy reference gene and fold changes were calculated by using the formula of 2 -∆∆Ct.
Statistical analysis: The Chi-square test was used to determine the association between ErbB1 and ErbB2 genes amplification. Correlation between HPLC and RT-PCR, IHC results was achieved by using the Pearson test and cutoff points and sensitivity and specificity of HPLC method were calculated by Radar Operator Curve (ROC). In addition, Pearson test was used for the correlation between ErbB1 and ErbB2 genes amplification with ER status. A value of p<0.05 was considered to be statistically significant. All the analyses were performed using IBM SPSS 22 statistical software (Armonk, NY).
Results :
Analysis of ErbB1 and ErbB2 genes amplification: The differential PCR products of ErbB1 and ErbB2 genes related to 20 samples of the normal human blood and 30 samples from primary breast cancers were analyzed by agarose gel electrophoresis and HPLC method. In these experiments, DNA extracted from BT-474 cell line which had been confirmed to have 6 copy numbers of ErbB2 gene 15 was used as a positive standard. In this study, DNA of MCF7 cell line which is ER positive was used as a negative standard. PCR products of the ErbB1 oncogene (retention time=11 min. CV=1.3%), ErbB2 oncogene (retention time=10.4 min. CV=1.48%) and reference gene (retention time=11.5 min. CV=2%) related to all normal and cancer specimens were separated reproducibly by the HPLC method developed in this study.
Figures 1 and 2 show chromatograms and electropherograms of amplification products of ErbB1 and ErbB2 oncogenes in comparison to interferon gamma gene, respectively. HPLC results indicated that elutions of peaks were in the order of increasing chain length of the PCR products. As shown in figures 1A and 2A, the eluted peaks were respectively related to ErbB2 (98 bp), ErbB1 (118 bp) and INFγ (150 bp) fragments. Analysis of photographs of agarose gels showed that gel electrophoresis is a less sensitive method for differential detection of ErbB1, ErbB2 and INFγ genes amplification as compared to HPLC method (Figures 1 and 2) since electrophoresis method is not able to separate ErbB1 and INFγ gene fragments which have less than 50 bp difference. In addition, the amount of each PCR product by HPLC method was analyzed quantitatively. PCR products of INFγ gene were used as an internal control for assessment of the PCR amplification efficiency and inter-sample DNA variability. Extracted data from each peak area of each gene product was used for quantitative analysis of fold changes in ErbB1 and ErbB2 genes amplification. Amplifications of ErbB1 and ErbB2 genes in 20 normal blood samples were assessed (mean±SEM fold increase) as 3.5±2.5 and 2.1±1.4 fold increase, respectively, using HPLC analysis. Control results were used for normalizing the test results.
Based on data extracted from coordination of the ROC for ErbB2 results, the cutoff 2.25 leads to both sensitivity and specificity of 1.00. Thus, Twenty two of the specimens in our breast cancer cohort showed more than a two-fold amplification of ErbB2 oncogene. The same samples were positive for ErbB2 immunoreactivity as evaluated by IHC. Therefore, more than a two-fold amplification of ErbB2 gene was defined as a positive result for ErbB2 amplification by HPLC test.
The cutoff 2.15 was obtained for ErbB1 test results by ROC curve with sensitivity and specificity of 1.00. Ten out of 30 tumor specimens (30%) showed more than a two-fold amplification of the ErbB1 gene (Figure 3). Our HPLC data did not show any significant association between ErbB1 and ErbB2 genes amplification (p=0.90). HPLC analysis of PCR products for ErbB2 and ErbB1 genes in BT-474 cell line showed about a 6- and 4-fold increase, respectively as compared to control samples. This finding confirmed the validity of our HPLC data. It was found that ErbB2 and ErbB1 genes amplification in MCF7 cell line was less than a two-fold increase.
Analyzing a DNA size marker by HPLC: Figures 4A and 4B show size-based resolution of a 50 bp size marker using agarose gel electrophoresis and HPLC, respectively. As expected, close fragments of a 50 bp DNA size marker on agarose gel do not have enough resolutions in this method, whereas they can be recognized and precisely quantified by DNA chromatography. HPLC analysis for fragments of this DNA size marker demonstrated the resolving capability of this method of DNA chromatography especially with respect to the range of 50 to 150 bp fragments. Our results also revealed that separation of double-stranded DNA fragments is length-dependent and sequence independent. DNA chromatography is highly automated and provides accurate detection and quantification of DNA fragments in comparison to gel electrophoresis for the analysis of PCR products.
Comparison of HPLC results with RT-PCR and IHC data and estrogen receptor (ER) status: In order to evaluate our HPLC method versus the gold standard method of RT- PCR, amplification folds of ErbB1 and ErbB2 genes were assessed by RT-PCR for seven tumor samples and normalized by one normal specimen (Figure 5). The results showed significant correlations (2-tailed) between HPLC and RT-PCR data of both ErbB1 (Correlation coefficient (r) r=0.882, p=0.009) and ErbB2 (r=0.999, p=00.00) genes. Based on ROC curve, the results for ErbB1and ErbB2 testing by HPLC in comparison to RT-PCR method were accurate and the area under the curve for both ErbB1and ErbB2 assay results was 1.00 with 100% sensitivity and 100% specificity [(CI (95%), p=00.00)]. That shows the HPLC tests indicate all actual positive and negative results. Also, the results of HPLC amplification fold for ErbB2 oncogene were compared with IHC results in 30 cases. Our data revealed that HPLC analysis is more accurate than IHC in detection and quantification of ErbB2 gene amplification. The results of IHC for ErbB2 significantly correlated (1-tailed) (r=0.339, p=0.034) with data obtained by the HPLC method. No correlation was observed between IHC results for ER and amplification levels of ErbB1 (r=0.069, p=0.716) and ErbB2 (r=0.207, p=0.272) assessed by the HPLC method. Moreover, no association between ER negative and ErbB2 positive specimens was found. This may be due to the fact that only 4 out of the 30 cancer specimens were ER negative and among them, two samples were positive for ErbB2.
Discussion :
There is a highly significant correlation between the ErbB2-targeted therapy and its gene amplification 5,10. The overexpression of ErbB2 protein occurs in breast cancers because of gene amplification. Therefore, detection of its gene amplification and protein expression is occurred in tumor samples by FISH and IHC methods, respectively and both of them correlated well with ErbB2 protein expression 19. ErbB1 is overexpressed in many tumors and is a strong prognostic indicator for ovarian, cervical, bladder, HNSCC and oesophageal cancers. In the case of ErbB1 overexpression, there was a relationship between anti-ErbB1 drugs and its protein expression for cancer therapy 20. It has been reported that ErbB1 gene copy number is somehow correlated with its protein expression. ErbB1 gene copy number is detected by FISH and RT-PCR and its protein expression is measured by IHC. Both RT-PCR and FISH are costly and their technical setting may limit the use of these techniques 13. IHC is the most commonly used method for determination of ErbB1 and ErbB2 protein expressions. It is a relatively quick and simple technique; however, it is not strictly quantitative and it lacks a standardized method for interpretation of stained samples 12,13.
Oncogene amplification determination by means of two fragments corresponds to two different genes analyses in PCR and it was applied previously 15. Based on available instruments in laboratories, PCR-based methods have been developed to cost-effective assays for determination of copy number changes 21. In the present study, ErbB1 and ErbB2 oncogenes amplification in human primary breast cancers were determined using differential PCR and HPLC methods. In this study, an anion-exchange HPLC method was developed for separation and quantification of PCR products corresponding to the target gene and a reference gene in 30 min and in a single step. Optimum resolution was obtained when a PRP-X600 column along with a NaCl gradient and a column temperature of 35C was used. Pervious reports demonstrated that under non-denaturing condition, PCR products were separated in a sequence independent manner in a good resolution for the fragment of above 80 bp 22. Separation of DNA fragments on anion-exchange column relies on the interaction between negatively charged phosphate groups on the DNA backbone and positively charged group on the resins 23. PCR products were eluted during a linear increase of salt concentration (Figures 1A and 2A). A DNA size marker (50 bp) was analyzed to confirm the sensitivity and resolution capabilities of DNA chromatography. By this method, the accurate separation of double-stranded DNA fragments between 50 and 150 bp was shown (Figure 4). Our data was consistent with previously shown results that sizing of DNA fragments was length-dependent and sequence independent 24. In addition, the retention times were highly reproducible in this HPLC method. As shown in figure 4, increasing DNA size which corresponds to the number of charges of the molecule increases the retention time. Since variant DNA concentration reflects small differences in PCR efficiency, the co-amplification of the target gene and reference gene (INFγ) was used to normalize this variation. Determination of the ratio of the target gene peak area/INFγ peak area for each test eliminates the intrinsic variation in PCR efficiencies between different DNA samples and reflects the target gene amplification. In order to detect amplification fold for target genes, the ratio of test samples was compared to the average ratio of the 20 controls. Thus, it permits to calculate amplification fold by normalizing the gene amplification to normal population.
In figures 1B and 2B, the separation of the DNA fragments with close sizes by agarose gel electrophoresis is shown to have low resolution. This study confirmed that analysis of PCR products by the use of agarose gel electrophoresis and densitometry had lower sensitivity than HPLC method for separation of the DNA fragments with less than 30 bp difference. Since in this HPLC procedure the analysis of microgram amounts of PCR fragments gave accurate results for precise quantization, it was made possible to rapidly separate DNA fragments with about 30 bp difference with high resolution. Therefore, analysis of gene amplification is feasible to perform. Our HPLC results for ErbB1 and ErbB2 genes amplification were confirmed by RT-PCR (Figure5). The HPLC data was significantly correlated with the results obtained by our gold standard method for seven samples which shows the accuracy of this method. However, there was a limitation in this study since all of our test and control samples could not be assessed by RT-PCR because this method is getting too expensive in our country. In this study, a 6-fold ErbB2 gene amplification and a 4-fold gene amplification of ErbB1 in BT-474 cell line were found by using HPLC method. These results are consistent with previous findings for this cell line 15. Beside accuracy, the separation of PCR products by HPLC is a cheap alternative method to RT-PCR for routine measurement of ErbB1 and ErbB2 genes amplification.
In spite of previous reports about the inverse correlation between ErbB1 and ErbB2 genes amplification with estrogen receptor status 8,9, no correlation between them was found. It could be due to the use of the small number of samples in this study.
Conclusion :
HPLC analysis of DNA fragments generated by differential PCR provides an accurate detection and quantification method for determination of ErbB1and ErbB2 genes amplification. In addition, sizing of PCR products by HPLC using anion-exchange column provides an accurate and automated alternative to gel electrophoresis and IHC and a cheap method compared to RT-PCR analysis.
Acknowledgement :
This work was supported by grant No: 85-3185 from Shiraz University of Medical Sciences, Iran. Hereby, we acknowledge the cooperation of Dr. Ahmad Monabati from Pathology department of Shiraz University of Medical Sciences, Shiraz, Iran.
Conflict of Interest :
None of the authors has any conflict of interest.
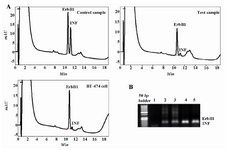
Figure 1. HPLC separation and electropherogram of the PCR products from the ErbB1 oncogene and the interferon gamma (INFγ) gene for the detection of the ErbB1 gene amplification. A) Chromatograms showing the results for normal DNA (control), DNA from breast tumors (test) and BT-474 breast carcinoma cell line (high copy control); B) Lanes 1, 2-3, 4 and 5 are respectively blank, controls, high copy control and DNA from primary breast carcinoma. The PCR products of INFγ and ErbB1 genes are very close together
|
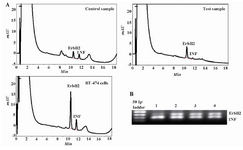
Figure 2. HPLC separation and electropherogram of The PCR products from the ErbB2 oncogene and the interferon gamma gene (INFγ) for the detection of the ErbB2 gene amplification. A) Chromatograms showing the results for normal DNA (control), DNA from cancerous breast (test) and BT-474 breast carcinoma cell line (high copy control); B) Lane 1 is high copy control, lanes 2 and 3 are DNA from primary breast carcinoma and lane 4 is normal breast tissue
|
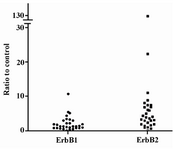
Figure 3. Amplification folds of ErbB1 and ErbB2 oncogenes in 30 tumor samples. PCR products for tumor samples were analyzed by HPLC method. The relative amplification folds of ErbB1 and ErbB2 genes were quantized as a ratio to the amount of IFNγ
|
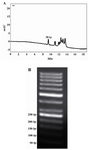
Figure 4. A 50 bp DNA ladder fragment sizing. A) HPLC analysis of a double-strand 50 bp size marker was performed. The fragments were separated from light to heavy chains from left to right. B) Analysis of DNA fragment sizing on 2% agarose gel
|
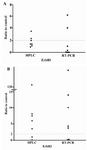
Figure 5. Relative amplification folds of ErbB1 and ErbB2 genes determined by HPLC and real time PCR (RT-PCR). A) Amplification fold of ErbB1; B) Amplification fold of ErbB2. The relative amplification folds of genes were quantized as a ratio to the amount of IFNγ. An amplification fold of >2 was defined as being positive for malignancy
|
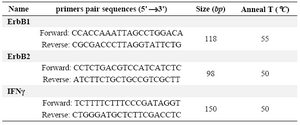
Table 1. PCR primer sequences used for ErbB1 and ErbB2 genes
|
|