Fourier Transform Infrared Spectroscopy: A Potential Technique for Noninvasive Detection of Spermatogenesis
-
 Gilany, Kambiz
Reproductive Biotechnology Research Center, Avicenna Research Institute, ACECR, Tehran, Iran, Tel: +98 21 22432020 ;Email: k.gilany@avicenna.ac.ir
Gilany, Kambiz
Reproductive Biotechnology Research Center, Avicenna Research Institute, ACECR, Tehran, Iran, Tel: +98 21 22432020 ;Email: k.gilany@avicenna.ac.ir
-
Reproductive Biotechnology Research Center, Avicenna Research Institute, ACECR, Tehran, Iran
-
Sadeghi, Mohammad Reza
-
Reproductive Biotechnology Research Center, Avicenna Research Institute, ACECR, Tehran, Iran
Abstract: Background: The seminal plasma is an excellent source for noninvasive detection of spermatogenesis. The seminal plasma of normospermic and azoospermic men has been analyzed for detection of spermatogenesis.
Methods: Optical spectroscopy (Attenuated Total Reflectance-Infrared spectroscopy (ATR-IR) and Fourier Transform infrared spectroscopy (FT-IR) has been used to analyze the seminal plasma and the metabolome of seminal plasma for detection of spermatogenesis.
Results The seminal plasma of normospermic and azoospermic men has been analyzed by ATR-IR. The results show that there is a pattern variation in the azoospermic men compared to normospermic men. However, the seminal plasma is too complex to show significant pattern variation. Therefore, the metabolome which is a subcomponent of the seminal plasma was analyzed. The seminal plasma metabolome of normospermic and azoospermic men has been analyzed by FT-IR. A significant pattern change was observed. The data combined with chemometrics analysis showed that significant changes are observed at metabolome level.
Conclusion: We suggest that FT-IR has the potential as a diagnostic tool instead of testicular biopsy.
Introduction :
Human semen is an organic fluid that consists of spermatozoa (in some instances leucocytes and epithelial cells) and seminal plasma 1,2. Human semen is routinely analyzed by light microscopy and Computer Assisted Semen Analysis (CASA) in regard to conventional spermatozoa characteristics such as morphology, motility, forward progression, and concentration 3. Other studies use ultrastructural analysis of spermatozoa by Transmission Electron Microscopy (TEM), functional assays to distinguish between fertile and infertile men, and flow cytometry studies for semen samples, etc 3-5.
Azoospermia affects 10-15% of infertile men attending infertility clinics. Currently, testicular biopsy is the gold standard procedure for evaluating spermatogenesis status in men with azoospermia. Significant efforts were made to look for a non-invasive method for detection of spermatogenesis 6. Therefore, it is revealed that human seminal plasma is an excellent source for diagnosis of azoospermic men.
Metabolomics is defined as the metabolome expressed by the organism 7. The metabolome consists of small molecules (metabolites) less than 2 kDa including peptides, oligonucleotides, sugars, nucelosides, organic acids, ketones, aldehydes, amines, amino acids, lipids, steroids, alkaloids, vitamins, and minerals. The metabolome is the closest correlate to phenotype 8. Therefore, it is logical to search for a biomarker and a diagnostic test at the metabolome level.
There is a gap of data regarding molecular aspects of male infertility which can be employed as a diagnostic test 9. We believe that FT-IR spectroscopy might be the method of choice, as it has become an accepted tool for the characterization of the complex building blocks of biological systems such as proteins, nucleic acids, lipids, carbohydrates, and metabolites. FT-IR spectroscopy has proven to have a diagnostic potential. Several research groups reported its use for identification, differentiation, and classification of microorganisms 10,11. Among its numerous applications, differentiation of normal from cancerous cervical tissue, normal and cancerous colon tissue, normal and malignant lymph cells and tissue, and investigation of brain cancer were reported 12-16. To improve FT-IR results, several studies have combined FT-IR results with chemometrics 17-21. To our best of knowledge no previous study has been published about the use of optical spectroscopy, ATR-IR and FT-IR to analyze human seminal plasma for the purpose of identifying molecular aspects of male infertility.
In this study, we have first compared the results of ATR-IR obtained from human seminal plasma of normospermic versus azoospermic men. In addition, we have improved the results by FT-IR spectroscopy of the metabolome of human seminal plasma in normospermic versus azoospermic men. To our best of knowledge, this is the first study in which significant changes were observed between the metabolome of human seminal plasma in normospermic versus azoospermic men using FT-IR spectroscopy.
Materials and Methods :
Preparation of the human seminal plasma: Human seminal plasma of ten volunteers was collected at Avicenna Infertility Clinic (AIC) affiliated to Avicenna Research Institute (ARI) in Tehran, Iran. Semen samples were collected by masturbation in a sterile wide-mouthed cup. Semen analysis was immediately performed according to WHO guidelines. Semen samples were centrifuged for 5 min at 3,000 rpm. The supernatant seminal plasma was quickly and carefully recovered and put to freeze at -20°C for upcoming measurements. The specimens were categorized into two groups according to the results of spermiograms: normospermic and azoospermic men. For ATR-IR cases, 6 samples of 1 µL of human seminal plasma were analyzed by ATR-IR (Bruker, Tensor 27). The ATR-IR spectra were collected for 30 s and in the wave number range of 400-4000 cm-1.
Extraction of human seminal plasma metabolome: The metabolome was extracted from human seminal plasma according to human serum metabolome extraction 22. Briefly, the metabolites of 4 samples of human seminal plasma were extracted by cold Methanol: H2O (9:1). The suspension was centrifuged at 6000 rpm for 8 min. The supernatants were transferred to new microtubes. The extracted metabolites were dried down by Speed Vacuum. The dried metabolomes of the human seminal plasma were dissolved in 100 µL of chloroform before it was dropped on the KBr crystal tablet and IR-spectra were collected by FT-IR (Bruker, Tensor 27). FT-IR spectra were collected in 30 s and in the wave number region of 400-4000 cm-1. The raw intensity of FT-IR data was used for PCA analysis.
PCA analysis: For principle component analysis, MatLab software version 2012b (8.0.0.783) was used.
Results :
Pattern recognition by ATR-IR: Figure 1 shows the pattern obtained from the human seminal plasma of normospermic and azoospermic men. In these samples, we assumed that there are both proteome and metabolome. Additionally, it is possible to have free DNA in the sample as well. Since functional groups detected by ATR-IR also could include from free DNA. As it is shown in figure 1, the sample contains too many components. However, there is too much water in the human seminal plasma. This seems to interfere with obtaining optimal pattern among normospermic and azoospermic men. The low resolution of pattern could also be caused by complexity of human seminal plasma. In order to increase the resolution of pattern, we decided to look at subcomponents of human seminal plasma, metabolome, by ATR-IR.
The extracted metabolome was analyzed by ATR-IR. However, the spectra looked like figure 1. Therefore, we concluded that the broad band observed in the O-H region of spectra causes suppression of other variable region. Therefore, we decided to drop the analysis in the liquid form by ATR-IR.
Metabolome fingerprinting of azoospermia using FT-IR: In order to improve the resolution of components, we decided to focus on metabolites of human seminal plasma 23. We dried down the extracted metabolome and dissolved it in the chloroform and analyzed it by FT-IR. Figure 2 shows fingerprint region of FT-IR from human seminal plasma metabolome of normospermic and azoospermic men. It is clear the variation observed in FT-IR in the fingerprint region is significant. However, there was not such a huge difference in the upper region of spectra (>1000 wave number cm-1) (data not shown).
In functional groups in the fingerprint region, significant patterns of changes were C-Cl, C-O, C-N and C-C 24. The exact place of these functional groups in the spectra is unclear. Probably, C-C or C-N functional groups are in the region of 750-800 cm-1.
To get a better and more accurate measurement of FT-IR analysis, we decided to use chemometrics to the obtained FT-IR results 25. Principle Component Analysis (PCA) was performed on the data acquired from FT-IR of metabolome of human seminal plasma. The first two scores were plotted against together as a score plot. Figure 3 shows scores plots of PC2 versus PC1 in the whole pattern obtained by FT-IR.
As it is shown in figure 3, the score plot has adequately separated the normospermic and azoospermic men in each side of diagram. This means that FT-IR could be used for the metabolome changes in azoospermia and the screening of spermatogenesis in azoospermic men.
Discussion :
Optical spectrospcopy is an excellent technique for diagnosis. Pattern recognition by FT-IR is an easy and a cheap diagnostic test. In the IR different functional groups of peptides, proteins and metabolites can be detected. We applied ATR-IR and FT-IR on whole and extracted metabolites of human seminal plasma.
In the ATR-IR, the sample can be measured in liquid form. Analysis of human seminal plasma in the liquid form showed that there are many components in human seminal plasma in which significant variation can be observed (Figure 1). We decided to focus on the subcomponents. We extracted the metabolome from human seminal plasma and analyzed it by ATR-IR. However, the O-H group had strong signal and suppressed the signal of lower part of spectra which is shown in figure 1. We decided to analyze the extracted dried metabolome by FT-IR. The advantage of dried sample is that methanol and water will evaporate and only dried metabolome will be left (Figure 4).
The dried metabolome was then dissolved in the chloroform. The chloroform signal will not interfere with metabolites signal (600-4000 cm-1 wave number). As we expected, the fingerprint region of FT-IR spectra showed significant changes. Additionally, it was quite reproducible. We believe that FT-IR could be used for quantification of the extracted metabolome in function groups, if we had access to white diamond liquid sample cell for FT-IR. In order to improve our results, the chemometrics method, PCA, was applied on the obtained data. As it is shown in figure 3, the normospermic and azoospermic men are separated quite differently.
One of the problems, which limited sample collection (inability to collect more than 4 samples each time), was that KBr crystal tablet lost its reproducibility. We believe the reason was that metabolites bind to KBr crystal and we were not able to wash it even with several trials. Therefore, we suggested using white diamond liquid holder for FT-IR measurement. We believe using white diamond liquid holder will improve the obtained results and make FT-IR spectra useful for quantification of metabolome. Another instrument which could be used for pattern recognition is Raman spectroscopy 26. In this method, liquid can be used and measured quite easily since water does not interfere with the spectra. It is an ideal instrument for human body fluid measurement. However, it should be emphasized that the currently obtained result is preliminary and larger sample size analysis is needed for validation of the method.
Conclusion :
We have shown that chemometrics combined with FT-IR can be used as a simple, fast and cheap screening method for separating human seminal plasma of normospermic versus azoospermic men. Although, this method is a non-invasive way for fast diagnosis of azoospermia, it cannot reveal the details of the problem and biopsy might be needed for having more information on azoospermia.
Acknowledgement :
We would like to thank the entire participants in this small project. We will additionally thank Avicenna Research Institute for the Grant.
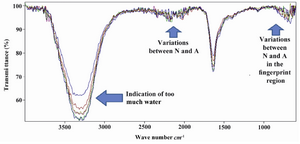
Figure 1. ATR-IR measurement of 1 µL liquid of whole human seminal plasma, including proteome and metabolome. N) Nor-mozoospermic and A) Azoospermic men
|
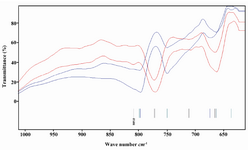
Figure 2. FT-IR spectra from extracted dried metabolome of human seminal plasma of normozoospermic and azoospermic men
|
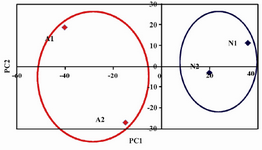
Figure 3. PCA analysis of data obtained from figure 2. N) Normozoospermic; A) Azoospermic
|
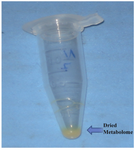
Figure 4. The extracted dried metabolome from human seminal plasma
|
|