Predictions of Protein-Protein Interfaces within Membrane Protein Complexes
-
 Abdolmaleki, Parviz
Department of Biophysics, Faculty of Biological Sciences, Tarbiat Modares University, Tehran, Iran , Tel: +982182883404; E-mail: parviz@modares.ac.ir
Abdolmaleki, Parviz
Department of Biophysics, Faculty of Biological Sciences, Tarbiat Modares University, Tehran, Iran , Tel: +982182883404; E-mail: parviz@modares.ac.ir
-
Department of Biophysics, Faculty of Biological Sciences, Tarbiat Modares University , Tehran, Iran
Abstract: Background: Prediction of interaction sites within the membrane protein complexes using the sequence data is of a great importance, because it would find applications in modification of molecules transport through membrane, signaling pathways and drug targets of many diseases. Nevertheless, it has gained little attention from the protein structural bioinformatics community.
Methods: In this study, a wide variety of prediction and classification tools were applied to distinguish the residues at the interfaces of membrane proteins from those not in the interfaces.
Results: The tuned SVM model achieved the high accuracy of 86.95% and the AUC of 0.812 which outperforms the results of the only previous similar study. Nevertheless, prediction performances obtained using most employed models cannot be used in applied fields and needs more effort to improve.
Conclusion: Considering the variety of the applied tools in this study, the present investigation could be a good starting point to develop more efficient tools to predict the membrane protein interaction site residues.
Introduction :
A wide range of essential cellular functions are mediated by membrane proteins. For example, the exchange of membrane-impermeable molecules between organelles and between a cell and its extracellular environment are facilitated by channels and pumps. In addition, transmembrane receptors sense changes in the environment and commence specific cellular responses typically via their associated proteins. Membrane proteins are also of great diagnostic and therapeutic importance, so that they are targets of >50% of all current drugs 1.
For the diverse biological functions in a living cell, various interactions among proteins are inevitable. Knowledge about these interactions will improve our understanding of the general principles underlying biological systems function 2. Structural details of protein-protein interactions will also help in posing experimentable mechanistic hypotheses for protein complexes. In addition, it provides a basis for structure-based discovery of therapeutic compounds to manipulate these interactions.
Although for the cytosolic proteins these interactions have been the subject of intense research, but less is known for the membrane proteins 3. In fact, traditional protein chemistry techniques have not been helpful to study the membrane proteins, because they are typically hydrophobic macromolecules 4. It is well known that the largest part of the binding free energy of protein interaction is contributed by a few key residues 5. Experimental methods for detecting the key residues of interaction domains, such as alanine scanning mutagenesis are also not applicable on large scales because they are expensive and time-consuming 6. Therefore, efficient and reliable computational methods for identifying these residues from sequences are urgently required.
To our knowledge, research on developing computational approaches for predicting the interaction sites in membrane proteins is limited to only one study by Bordner et al 7. In the present investigation, we have attempted to address this problem with the aim of achieving a more efficient and accurate method for prediction of key residues of membrane protein interaction sites. For this reason, we have constructed many predictive models to classify the surface lipid-facing residues of membrane proteins based on their existence in the interaction interface within membrane protein complexes.
Materials and Methods :
Dataset:The only dataset of membrane proteins to date collected and used for the only membrane protein interaction site prediction study, was taken from Bordner 7. In addition to the taken dataset which was used for performance comparison purposes, another dataset was collected and used as an independent test set. Again for comparison purposes, we utilized the PDBTM database 8,9 in order to construct this dataset in the same way as the Bordner’s was collected. PDBTM updates since 2010 including 502 added complexes plus 9 modified structures was taken and culled using PISCES web server 10 to form a non-redundant set of membrane protein complexes in which no pair of complexes had all proteins differing by more than 30% sequence identity. The set contains alpha-helical as well as beta-barrel complexes in different oligomeric states including monomeric, homo- and hetero-multimeric complexes.
From the non-redundant set of membrane proteins obtained this way, the independent test data were extracted. Only surface residues, with relative solvent accessible surface area (SASA) ≥0.2, which are also within the hydrophobic core of the membrane, were included in this set. In order to attain relative values of accessible surface area, solvent accessibility is defined as the ratio of the solvent accessible surface area of a residue in the folded state and that of the residue in an extended tripeptide (Gly-X-Gly) conformation. The residue solvent accessibility value was computed by means of ASAView program, a web server available online at http://gibk26.bio.kyutech.ac.jp/ jouhou/shandar/netasa/asaview 11. The membrane boundaries were predicted using PDBTM-TMDET server 12 and used for determining the membrane core residues. If a Z-axis is hypothesized perpendicular to the plane of the membrane predicted by TMDET, with the origin being in the center of the membrane, then residues in the membrane core have Z-coordinates with |Z| ≤15 Å. In other words, the membrane core is assumed to be 30 Å thick. Each surface residue located at the membrane core was labeled either as a binding site or interface residue (denoted with I), if it had <4 Å non-H atom separation from another protein chain in the complex structure, otherwise as a non-binding site or non-interface residue (denoted with N).
Training data for each individual residue included the frequencies of each of the 20 standard amino acids in a multiple sequence alignment of similar sequences and the evolutionary rate. To create the sequence alignments, similar protein sequences were first searched for in the NCBI nr database with BLAST 13 at an E-value cutoff of 10-2; then redundant sequences at the 90% sequence identity level were removed using the CD-HIT program 14, and the multiple alignments of the remaining sequences were generated with MUSCLE 15. The residue frequency for a particular residue type was simply computed as the fraction of residues of that type in the corresponding multiple sequence alignment column. Only proteins with at least 20 sequences in the final alignment were included in the training and testing sets. The evolutionary rate was calculated using the REVCOM method 16, which in evolutionary conservation values are more robust to the particular set of sequences and local alignment errors than other methods. Evolutionary rates obtained this way vary inversely with conservation.
In classification problems, the training data will considerably affect the classification accuracy. However, the data in real applications have often imbalanced class distribution, i.e. most of the data are in majority class and little data are in minority class. In this case, if all the data are used as the training data, the classifier would tend to predict that most of the incoming data belongs to the majority class. Therefore, it is important to adopt suitable methods for classification in the imbalanced data problems 17. Of the most common approaches to deal with the class imbalance problem are over-sampling and under-sampling techniques. The over-sampling approach increases the number of minority class samples to reduce the degree of imbalanced distribution. Under-sampling approach is supposed to reduce the number of samples with the majority class 17. Generally, the performances of over-sampling approaches are worse than those of under-sampling ones 18; so, we applied the under-sampling approach to address the data imbalance. The whole dataset contains 122 proteins which include the whole sample size of 8,365 residues. 2,391 out of 8,365 residues are interfacial residues and the remaining 5,974 are non-interfacial. To implement the under-sampling method, all class N samples with NaN values for the evolutionary parameter (1,477 N samples) were removed, and an additional 2,106 samples were also randomly removed to reach equal sample size between the classes I and N (both classes containing 2,391 samples). Missing values of evolutionary parameter in class I (332 I samples) were replaced by intra-class mean.
Prediction using weka classifiers:Weka 19 is an open source data mining and machine learning package implemented in Java. Many researchers and practitioners in the data mining and machine learning community commonly use Weka. As a comprehensive tool, Weka provides an interface for implementing many modeling algorithms in a user-friendly manner. Classification tools are also included in this software environment. The total 110 classifiers are grouped in seven categories.
We employed Weka version 3.6.8 to classify the membrane protein residues in I and N classes. Due to different limitations in data and/or algorithms we could apply 71 of these classifiers. All the parameters of classifier models were set to their default values.
Prediction using ℓ1/ℓq-regularized logistic regression:The ℓ1/ℓq-regularized logistic regression (RLR) model used in this study, is a generalization of the ℓ1-regularization logistic regression. This model has strong theoretical guarantee, and has exhibited great empirical success arisen from recent studies in areas such as machine learning, statistics, and applied mathematics 20-24. Regarding this fact, we adopted this model to deal with the problem of predicting the interaction class of residues at the interfaces of membrane proteins.
The ℓ1/ℓq-regularized logistic regression is an expression of the form:
(_x^min)∑_(l=1)^k▒∑_(i=1)^m▒〖w_il log〖(1+exp(-y_il (x_l^T a_il+c_l ) ) )+λx_(l_1/l_q ) 〗 〗
where aiℓ indicates vector of size 1×n; n is the number of features for i-th residue of the ℓ-th interaction class; wiℓ is the weight for aiℓ; yiℓ is the response of aiℓ; and cℓ is the intercept for the ℓ-th interaction class. Since the RLR model assigns weights to dependent variables, it gives a measure of preference and avoidance of different residues in the interaction sites and thus it can be used as a feature selection tool 25. To construct the ℓ1/ℓq-regularized logistic regression we used mcLogisticR function of SLEP package version 4.0 26 which is written in Matlab. In this function, the elements in y are required to be an m×k matrix including elements of 1 or −1 (m is the number of residues and k is the number of interaction classes).
Prediction using tuned support vector machine:Kinds of learning machines based on statistical learning theory are called Support Vector Machines (SVMs). They have three remarkable characteristics: the absence of minima, the sparseness of the solution, and the implementation using the kernel Adatron algorithm. The kernel Adatron maps inputs to a high-dimensional feature space, and then optimally separates data into their respective classes by isolating those inputs which fall close to the data boundaries. Therefore, the kernel Adatron is especially effective in separating sets of data which share complex boundaries. SVMs seek a global optimized solution and avoid over-fitting in the training process; they can only be used for classification, not for function approximation. The theory and algorithms of SVMs can be found in Vapnik (1995, 1998) 27,28.
In this study, we applied the tune function of e1071 package 29 in the R environment version 2.12-0 30 to develop our SVM-based method. The tune function uses Grid Search to find the best functions. Using the tune function through cross-validation procedure, it provides as many simulations as the number of cross-validation folds in databases to select optimum model structure each time.
Evaluation criteria:In the two-class scenarios, one class with high identification importance is referred to as the positive class and the other as the negative class. After a classification process, samples are categorized into four groups, including TP (true positives: number of correctly classified interface residues), TN (true negatives: number of correctly classified non-interface residues), FP (false positives: number of non-interface residues incorrectly classified as interface) and FN (false negatives: number of interface residues incorrectly classified as non-interface). Several measures for the evaluation of model's performance can be derived using these scalar indices. Prediction accuracy (PA) is the best-known and most common of these measures, which is defined as:
PA= (TP+TN)/(TP+FP+FN+TN)
ROC curve provides a good summary of the performance of a classification model. It measures the classifier performance over the whole range of thresholds from 0 to 1 from the plots of Sensitivity (TP/(TP+FN)) and Specificity (TN/(TN+FP)). The area under a ROC curve (AUC) gives a single measure of classifiers’ performance for evaluating which model is better on average. The ROC curve was plotted using the 10-fold cross validation results.
Results :
Many predictor models were applied in this investigation to achieve the best possible classification accuracy in prediction of interaction site residues. In order to obtain an accurate estimation of the prediction performance for novel data, the data was divided so that all residue data for a particular protein was contained entirely within one of the training or testing sets. And the predictions were made for a distinct set of proteins from those used to train the predictor model. The classifier models were trained and tested using 10-fold cross-validation technique, whereby the whole set is divided into ten sets, each containing equal number of samples. The method was trained on nine sets and the performance was measured on the remaining tenth set. This procedure was then repeated ten times in order to trust that all members of the dataset had been selected in the testing procedure. The performance of the model was evaluated by averaging the mentioned measures over ten sets. This way, we could hopefully expect to get a global conclusion on the whole of dataset.
Weka classifiers:Table 1 indicates the prediction accuracies obtained by the total 71 predictor models of Weka, on the independent test set. As can be seen, the accuracy of most models is less than the acceptable value of 75%, and the best classifiers show accuracies around 76 or 77%. Such a weak performance would be too inadequate to be applied in the prediction of membrane protein interaction sites. However, the parameters of classifier models in Weka can be modified so that a higher performance is achieved. Regarding this fact, we chose to modify the best-performing classifiers to reach a higher prediction accuracy. The highest accuracy (77.14%) was obtained by the NBTree, a decision tree-based algorithm, but this classifier does not present additional parameters to be modified. The second best classifier was SMO, which is the Weka implementation of support vector machines (SVM). We relegated the modification of the SMO hyper-parameters to the tune function of another SVM implementation (Tuned SVM), whose promising results have been reported in subsection 3.3.
ℓ1/ℓq-Regularized logistic regression:We ran the Regularized Logistic Regression (RLR) method on the dataset in two subclasses using 10-fold cross-validation. The performance of this method was not satisfactory, and the model did not give a prediction accuracy higher than 66.28% on Bordner's dataset and 59.08% on the independent test set. Thus, despite the strong theoretical guarantee and the great empirical success of the model, we can only state that the regularized logistic regression model is not applicable in the membrane protein interaction site prediction problem using the available features.
Nevertheless, we used the capability of feature selection of this model as a criterion to estimate the relative contribution of each feature in the interaction interfaces of membrane proteins. Table 2 lists the features in the order of importance suggested by RLR model. The contribution order is also compared with that obtained in the only previous similar study by Bordner 7. The contribution orders are in relative accordance with each other. Evolutionary rate and frequency of Alanine, Leucine, Glycine and Valine are proposed by both studies to mostly contribute in interaction interfaces and frequency of Glutamine, Glutamic acid, Asparagine, Tyrosine, Aspartic acid and Threonine are proposed by both to be the least contributing factors.
Tuned support vector machine:We used the tune function to select optimized structure of SVM through 10-fold cross-validation test. The most important hyper-parameter of tuned SVM topology is kernel function and search for the best one among four different kernel functions, i.e., linear, polynomial, radial, and sigmoid was carried out. The best kernel was found to be the radial basis function. In addition, the kernel-related parameter gamma was searched for the best value and gamma=0.01 was reported as the optimum value by the model. Cost of constraints violation, which is the "C" constant of the regularization term in the Lagrange formulation of the SVM model was also searched and the optimum value of cost=32 was obtained. Then, the SVM model using the optimal set of hyper-parameters was constructed and employed for classification of membrane protein residues.
This tuned support vector machine model could classify the samples of Bordner's dataset by 86.95% accuracy and showed a prediction accuracy of 82.17% on the independent test set. The ROC curve was plotted using the 10-fold cross validation results, and has been illustrated in figure 1. AUC value for the tuned SVM model is obtained as 0.812 which shows a remarkable improvement in comparison with the value AUC=0.75 obtained in Bordner’s study which similarly has used all lipid-facing residues 7. Prediction of the interaction site residues in the independent test set also gives acceptable AUC value of 0.786. Therefore, the applied tuned SVM model outperforms the more complicated Random forests model employed in the only previous similar investigation 7.
Discussion :
In this study, more than 70 predictive and classifier models were applied to classify the surface lipid-facing residues of membrane proteins based on their existence in the interaction interface within membrane protein complexes. Among experimented models, the tuned support vector machine classifier could show a high performance in distinguishing the interacting residues from non-interacting ones, at the interaction interfaces of membrane proteins. This model outperforms the result obtained by the only previous study which has been devoted to prediction of membrane protein interaction sites 7.
Though the obtained performance by tuned SVM is a satisfactory result, the performances of the most models applied may still be interpreted as weak. In this regard, it should be emphasized that achieving high performance of predictive models in the prediction of protein-protein interaction sites has been a difficult task 6. Considering this issue, it is necessary to discover new theories, algorithms and features in order to further improve the performance of such prediction tasks, especially about membrane-associated proteins. As may be expected, separate predictors trained on membrane or non-membrane protein classes are required in order to achieve good prediction accuracy, because each of these classes experience different physiochemical environments, resulting in different frequencies of surface residue types for each class 7.
Computational studies of membrane protein interaction sites have been previously performed with different aims, including improvement of membrane protein crystallization 31, recognizing the membrane protein types 32, identifying the hub proteins within complicated membrane protein network systems 33, and discrimination of outer membrane proteins 34. Another research has considered the protein-protein interfaces in transmembrane domains of outer membrane proteins, with the purpose of determining their oligomerization states. Their predictions using only sequence information has obtained the accuracy and specificity of 96% and 94%, respectively 35. This indicates that high amount of information about the protein-protein interaction is hidden and can be extracted from the protein sequence data. Prediction of protein interaction sites has also found its applications in the form of web servers, like MEMSAT 36, MEMSATSVM 36, MEMPACK 36, PPI-Pred 37, cons-PPISP 38, meta- PPISP 39, PINUP 40, ProMate 41, SPPIDER 42, WHISCY 43, ConSurf 44, InterProSurf 45, ProteMot 46 and PrISE 47.
Weka classifiers did not give a satisfactory result, however construction of many models by using this tool provided a basis to choose the most powerful model (the tuned SVM) to perform the purposed classification task. Regularized logistic regression also could not classify the samples with desirable accuracy, but its feature selection capability allowed to obtain a measure for the degree of contribution of each predictor variable in the interaction class of residues. As proposed by this model, evolutionary rate and frequency of Alanine, Leucine, Glycine and Valine are the factors which mostly contribute in interaction interfaces and frequency of Glutamine, Glutamic acid, Asparagine, Tyrosine, Aspartic acid and Threonine are the least contributing factors. Our result, to a great extent, confirms the findings of the previous similar study 7. Thus, the preferred and avoided features proposed by these models may provide a basic knowledge which could be helpful in mechanistic, protein function and even the protein design studies. From structural point of view, our results are also consistent with findings of previous researches. According to these investigations, membrane proteins prefer a wide range of moderately stabilizing interactions instead of strong ones, which lends them a greater degree of flexibility in terms of conformation and stability 48. Furthermore, it has been found that the membrane protein-protein interface is enriched with weakly stable strands 35. In accordance with these findings, our results of preference and avoidance of amino acids in membrane protein interfaces show that non-polar amino acids which form weak hydrophobic interactions are preferred in these sites.
Conclusion :
Prediction of interaction sites could be a good starting point which helps to identify pharmacological targets, thereby helping drug design studies. The prediction methods could also find applications in guiding experimental investigations of membrane protein interactions, and also, in the prediction of protein complex structures using computational methods such as docking or threading 7. Identifying the binding site residues is also crucial for understanding the function of proteins.
Regarding the few investigations concerning the computational prediction of membrane protein binding sites, it would be recommended to explore new ideas, methods and features to further improve the performance of such predictions. Such a task could be performed by considering the results obtained by the numerous classifiers in this study. Modifications of the algorithms, tuning the parameters of better-performing models, adding more features to the available feature set and/or changing the data structures are of ways through which the prediction performance could be improved.
Acknowledgement :
We give our greatest thanks to all coworkers in Bioinformatics lab of Dr. Abdolmaleki, especially Mrs. Naddafi as the lab expert, for her kind helps in providing facility.
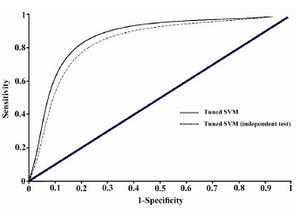
Figure 1. ROC plot illustrating the classification performance of tuned SVM model with the reference dataset and the collected independent test set. Related AUC values are 0.812 and 0.786, respectively
|
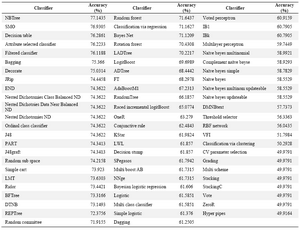
Table 1. The Weka classifier models and their accuracy of prediction on the independent test set
|
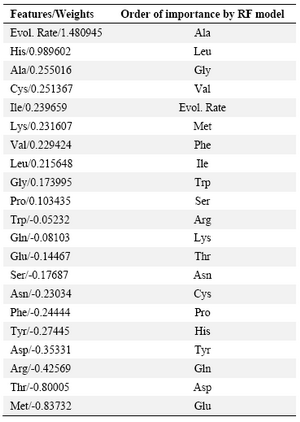
Table 2. Feature selection by RLR and its comparison with the previous study
All predictor variables are sorted by their RLR-assigned weights and the order of importance is compared with that of previously reported RF model (Bordner, 2009). Positive values show preference and nega-tive values show avoidance of the features in interaction sites
|
|