Thioredoxin System: A Model for Determining Novel Lead Molecules for Breast Cancer Chemotherapy
-
 Jamil, Kaiser
School of Life Sciences, Centre for Biotechnology and Bioinformatics (CBB), Jawaharlal Nehru Institute of Advanced Studies, Secunderabad, India, Tel: +91 40 27541551; Email: kj.bmmrc@gmail.com
Jamil, Kaiser
School of Life Sciences, Centre for Biotechnology and Bioinformatics (CBB), Jawaharlal Nehru Institute of Advanced Studies, Secunderabad, India, Tel: +91 40 27541551; Email: kj.bmmrc@gmail.com
-
School of Life Sciences, Centre for Biotechnology and Bioinformatics (CBB), Jawaharlal Nehru Institute of Advanced Studies, Secunderabad, India
-
Muhammed Mustafa, Sabeena
-
Centre for Biotechnology and Bioinformatics (CBB), Jawaharlal Nehru Institute of Advanced Studies, Secunderabad, India
Abstract: Background: Thioredoxin reductase 1 (TXNRD1) and thioredoxin interacting protein (TXNIP) also known as thioredoxin binding protein 2 or vitamin D3-upregulated protein 1 are key players in oxidative stress control. Thioredoxin (TRX) is one of the major components of the thiol reducing system and plays multiple roles in cellular processes. Computational analyses of TXNRD1, TXNIP and TRX expressions have not been analyzed in relation to prognosis of breast cancer. High expression of TXNRD1 and low expression of TXNIP are associated with worst prognosis in breast cancer.
Methods: Using bioinformatics applications we studied sequence analysis, molecular modeling, template and fold recognition, docking and scoring of thioredoxin as a target.
Results: The resultant model obtained was validated based on the templates from I-TASSER server and binding site residues were predicted. The predicted model was used for Threading and Fold recognition and was optimized using GROMACS. The generated model was validated using programs such as Procheck, Ramachandran plot, verify-3d and Errat value from Saves server, and the results show that the model is reliable. Next we obtained small molecules from pubchem and chembank which are databases for selecting suitable ligands for our modeled target. These molecules were screened for docking, using GOLD and scoring was obtained using Chemscore as a scoring function.
Conclusion: This study predicted the ligand interaction of four molecules with the minimized protein modeled structure and the best ligand with top scores from about 500 molecules screened. These were 3-hydroxy-2,3-diphenylbutanoic acid, 4-amino-3-pentadecylphenol, 3-(hydroxyimino)-2,4-diphenylbutanenitrile and 2-ethyl-1,2-diphenylbutyl carbamate, which are proposed as possible hit molecules for the drug discovery and development process.
Introduction :
Recent research has shown the importance of reduction/oxidation (redox) regulation in various biological phenomena. Thioredoxin (TRX) is one of the major components of the thiol reducing system and plays multiple roles in cellular processes such as proliferation, apoptosis, and gene expression (1). Reactive Oxygen Species (ROS) and the cellular thiol redox state are crucial mediators of multiple cell processes like growth, differentiation and apoptosis (2).
Increased levels of thioredoxin occurs in a number of human cancers, which may contribute to the resistance of cancers to therapy by scavenging ROS that are generated by various anti-cancer agents (3). Breast cancer is a kind of malignant tumor that occurs when cells in the breast becomes so over-active that they won’t stop multiplying (4). Using bioinformatics approaches we have analyzed the sequences of the TXNIP in order to develop a thioredoxin model which can be used as suitable target for determining novel lead molecules for breast cancer.
Members of the TRX system regulate apoptosis through a wide variety of mechanisms. A family of thioredoxin-dependent peroxidases (peroxiredoxins) protects against apoptosis by scavenging hydrogen peroxide. Thioredoxin-1 (Trx-1) is a small redox protein that is over-expressed in many human tumors, where it is associated with aggressive tumor growth and decreased patient survival. Trx-1 is secreted by tumor cells and is present at increased levels in the plasma of cancer patients. It is reported that Thioredoxin 1 (Trx-1) and Thioredoxin 2 (Trx-2) have opposed regulatory functions on hypoxia-inducible factor-1α* Thioredoxin 2 is a critical regulator of cytochrome c release and mitochondrial apoptosis; transmembrane thioredoxin-related molecule (TMX) has a protective role in Endoplasmic Reticulum (ER) stress-induced apoptosis (5).
Thioredoxin is known to have important roles in the cellular responses and several studies implicate thioredoxin as a contributor to cancer progression. In cancers the tumor environment is usually under either oxidative or hypoxic stress and both stresses are known up-regulators of thioredoxin expression (6).
The Trx system is a ubiquitous thiol-reducing system that includes Trx, Trx-interacting protein (Txnip), Trx reductase (Trxr) and NADPH. Trx is a small (12 kDa) protein with a conserved active site Trp-Cys-Gly-Pro-Cys that plays an important defensive role against oxidative stress by scavenging intracellular ROS. Binding of ROS leads to Trx oxidation. Trxr in the presence of NADPH can convert oxidized Trx back to its reduced form. Trx proteins are represented in the cell by at least two forms; Trx1 which is present in the cytoplasm and Trx2 which is localized in the mitochondria (7).
The major aim of our study was to analyze the Thioredoxin system as it is an important target in drug discovery studies for some diseases, but our aim was to use this system to identify cancer drugs from the drug-database; therefore computational methods were used to identify the possible inhibitors to thioredoxin.
Materials and Methods :
Thioredoxin sequence analysis
Thioredoxin sequence forms the basis of our study as this is a good target for cancer chemotherapy. We selected the gene sequences from UniProt KB, which is commonly used as knowledge base for molecular sequences. Most of the sequences in UniProt KB are derived from the conceptual translation of nucleotide sequences. It plays an important role by providing a stable, comprehensive, freely accessible central resource on protein sequences and functional annotation. We used computational analysis for the functional annotation for the gene sequences.
BLAST program with PSI-BLAST specification with PDB
Position Specific Iterative BLAST (PSI-BLAST) profile was generated from local alignments of the most highly scoring hits in the initial BLAST results by calculating position-specific scores for every position in the alignment in the sequences. Five template sequences were generated based on this alignment program. This iterative procedure increased the sensitivity of the BLAST search and helped us to identify new relationships between the query and database entries. Clustal W was used for Multiple Sequence Alignment Program (MSA) to determine the conserved sequences among the templates.
3-D model building
As the PSI- BLAST similarity obtained was less than 30%, we preferred the fold recognition method as the option to build 3-D model. Usually fold recognition methods are so efficient especially in the following cases: first, when the sequence has little or no primary sequence similarity to any sequence with a known structure. Second, when some model from the structure library represents the true fold of the sequence.
Our study falls into the first category in which we tried to recognize the structural fold of the target protein from a structure template library, given its sequence information and then generate an alignment between the query and the recognized template protein, from which the structure of query protein was predicted. We used I-TASSER web server (8) which has generated five predicted 3D models for the requests. A scoring function (C-score) based on the relative clustering structural density and the consensus significance score of multiple threading templates were obtained to estimate the accuracy of the I-TASSER predictions.
Scoring and validation of 3-D model
The output of the I-TASSER server for our query protein included the prediction of secondary structure, top five full-length models with confidence scores, the estimated TM-score, RMSD, standard deviation of the estimations and top ten templates. The binding site predicted by I-TASSER server suggests 26 amino acids residues as the possible binding site residues.
Threading/fold recognition
Modeller 8 was used to construct the model based on the generated templates for the following PDB ids 1G4MA, 2WTRB, 2R51A, 1CF1C, 2FAUA. All templates were taken based on their folds to construct the model.
Functional characterization of a protein sequence is a common goal in biology, and is usually facilitated by having an accurate three-dimensional (3-D) structure of the studied protein. In the absence of an experimentally determined structure, comparative or homology modeling can sometimes provide a useful 3-D model for a protein that is related to at least one known protein structure. Comparative modeling predicts the 3-D structure of a given protein sequence (target) based primarily on its alignment to one or more proteins of known structure (templates). The prediction process consists of fold assignment, target-template alignment, model building, and model evaluation (9).
The following threading programs were used to collect the templates:
1: MUSTER 2: HHSEARCH 3: SP3 4: PROSPECT2 5: PPA-I 6: HHSEARCH I 7: FUGUE 8: SPARKS
This model was optimized using GROMACS (10) which is a molecular dynamics package primarily designed for biomolecular systems such as proteins and lipids. The minimized model obtained was used for virtual screening in order to filter the compounds using GOLD score.
Molecular screening
The use of virtual screening to discover new inhibitors is becoming a common practice in modern drug discovery (11).
Receptor-based virtual screens seek to “dock” members of a chemical library against a given protein structure, predicting the conformation and binding affinity of the small molecules (12). All possible compounds which obey rule of 5 were collected from PUBCHEM, which is the main resource for obtaining freely-available bioassay data provided by the National Center for Biotechnology Information [NCBI] (13).
ZINC is a free database for virtual screening that contains over 4.6 million compounds in ready-to-dock, 3D formats, available at the URL http://zinc.docking.org. Molecules in ZINC are annotated by molecular property that include molecular weight, number of rotatable bonds, calculated LogP, number of hydrogen-bond donors, hydrogen-bond acceptors, chiral centers, chiral double bonds (E/Z isomerism), polar and a polar desolvation energy (in kcal/mol), net charge and rigid fragments. The database contains 494,915 Lipinski compliant molecules and 202,134 ‘lead-like’ molecules, having molecular weight in the range 150 to 350 with calculated LogP <4, number of hydrogen-bond donors ≤3 three, and number of hydrogen-bond acceptors ≤6. ZINC provides several search criteria such as molecular property constraint, ZINC codes, vendor based, and molecular substructure search (14).
Docking and scoring
The sorted ligands again were docked using GOLD and their interactions were studied. The protein was loaded into GOLD wizard, tailed by addition of hydrogens, then selection of binding site residues, choosing score (GOLD), and then the program. It is the first algorithm to be evaluated on a large dataset of complexes (15). The result gives an empirical free energy scoring function that estimates the free energy of binding of molecules.
The Chemscore function was implemented as a scoring function for the protein–ligand docking program GOLD, and its performance compared to the original Goldscore function in terms of docking accuracy, prediction of binding affinities, and speed. In terms of producing binding energy estimates, the Goldscore function appears to perform better than the Chemscore function and the two consensus protocols, particularly for faster search settings. Even at docking speeds of around 1–2 min/compound, the Goldscore function predicts binding energies with a standard deviation of ∼10.5 kJ/mol (16). Based on the interaction studies and the Lipinski’s rule of five, four molecules were selected as the hit molecules for further analysis in the wetlab. ChemDraw is the software used to sketch and build the molecular models.
Results :
Query sequence search using PSI-BLAST
Utilizing PSI-BLAST in the National Center for Biotechnology Information (NCBI), we searched the sequences based on the query (UniprotKB ID: Q9H3M7) with which we generated the five templates for Thioredoxin which are shown in (Figure 1). PSI-BLAST program increased the sensitivity of the BLAST search and helped us to generate the possible alignment between the thioredoxin query sequences and database sequences. It also constructed a position-specific substitution matrix for the query sequence during the search. The obvious advantage of this approach was that we could obtain more accurate statistical estimates, along with the application of BLAST/PSI-BLAST in terms of speed of aligning the sequences. This gave us five corresponding PDB hits and alignments. Furthermore, by using the Multiple Sequence Alignment Program we determined the conserved positions which are shown in figures 1A and 1B.
Construction of 3-D models
We constructed 3-D models of these templates utilizing the I-TASSER web server. The target sequences were first threaded through a representative PDB structure library to select the best possible models from PDB, based on the templates. Using I-TASSER we obtained the scoring values as C-score, TM- score (0.08) as well as RMSD (2 Å) values. Based on these models we could find the binding site residues. By aligning the templates and refining the iterative threading assembly (I-TASSER), Web server was used to integrate the platform for automated protein structure and function prediction. And we could generate five complete models with Combining confidence score (C-score) and protein length.
The algorithm of I-TASSER
The advantage of using I-TASSER is that it first generates three-dimensional (3D) atomic models from the amino acid sequences, and then it does multiple threading alignments and iterative structural assembly simulations. Hence, the function of the protein could be inferred by structurally matching the 3D models with other known proteins. The output from the webserver run was important because it contained the information of full-length secondary and tertiary structure predictions, and functional annotations on ligand-binding sites, enzyme commission numbers and Gene Ontology terms. The accuracy of the predictions was based on the C-score of the modeling which depicted the best equivalent residues of two proteins based on the structural similarity and the output of TM-score.
Search for the binding sites
Our search for the binding sites in the modelled structure was done by using I-TASSER server with which we could locate the exact positions of various amino acid residues at their respective binding sites. We made sure that these residues were in the binding pocket within the vicinity of the active site of the modelled protein, as shown in the results below:
PHE:14 ASN:15 ASP:16 PRO:17 GLU:18VAL:20 VAL:146 ASP:147 VAL:149 PRO:331 PRO:332 CYS:333 TYR:334 HIS:342ARG:343 LEU:344 GLU:345 SER:346TYR:366 GLU:369 PHE:370 MET:373 PRO:374 PRO:376 TYR:378 THR:379
The identification of putative ligand-binding sites on proteins is important for the prediction of protein function. Knowledge-based approaches using structure databases have become interesting, because of the recent increase in structural information (Figure 2).
Verification and validation of the model by PROCHECK, ramachandran plot, ERRAT value and verify-3D
Verification of the built model was done to ensure whether the model was programmed correctly and the algorithms were implemented. Validation results determined that the distribution of amino acid residues were at the most favourable region in the Ramachandran plot (more than 90%). This is an indication of the stereochemical quality of the model taken for the structural analysis, it and also validated the target-ligand binding efficacy of the structure. Ramachandran plot displays the main chain torsion angles phi, psi (φ, Ψ); (Ramachandran angles) in a protein of known structure (Figure 3).
Dihedral angle checks Ramachandran plot shows phi-psi distribution. Each residue is classified according to its region: ‘‘core’’, ‘‘allowed’’,‘‘generous’’, or ‘‘disallowed’’. Residues in the generous and disallowed regions are highlighted on the plot. A log-odds score shows how normal or unusual the residue’s location is on the Ramachandran plot for the given residue type. Procheck results gave us the value of 96.3 % residues in most favoured regions in R-Plot which suggests that they predict thioredoxin model of good quality (Figure 4A).
ERRAT is another program which we used for verifying crystal structures. Error values in this program are plotted as a function of the position of a sliding residue in the window. The error function is based on the statistics of non bonded atom-atom interactions in the modeled structure. ERRAT prompts the models to have the overall quality factor to be above 95%. And our results have shown that the value of overall quality factor was 95.506%. This confirmed that our developed model had reliable high resolution and quality compared to a database structures considered for the study (Figure 4B).
Further we analyzed the compatibility of our predicted (3D) model by utilizing Verify-3D program with its own amino acid sequence (1D). For each residue of the amino acid the scores of a sliding 21-residue window (from -10 to +10) were added and plotted. The returned 3D-1D profile showed 3D-1D score of above 0.2 and consisted of 92.33% of the residues in the predicted model (Figure 4C).
Statistical analysis
Statistical analysis in Ramachandran plot compared well with the observed and expected distributions of experimental observables and provided powerful tools for the quality control of our protein structure. The distribution of backbone dihedral angles (‘Ramachandran plot’) have often been used for such quality control, but without a firm statistical foundation. Hence the output for a protein structure is a Ramachandran Z-score, expressing the quality of the Ramachandran plot relative to current state-of-the-art structures.
Model optimization
Loop optimization for generating our model was done by using the software Modeller9V8 (17). The model had initial potential energy=55550610.692 and initial RMS gradient=1115700.680. For energy minimization of our model we used GROMACS program. This was done by using steepest descent algorithm for 1000 steps, and 5000 steps for conjugate gradient algorithm we obtained its potential energy as-931094.12296 and RMS gradient as 0.63272. The models are presented in (Figures 5A and 5B).
Results of docking studies
We selected the ligands from PUBCHEM and ZINC data bases (almost 400), and by virtual screening using MERCURY and MARVIN VIEW we could shortlist 4 ligands as the best fit ligands. These are listed below and are presented in table 1.
(i) 3-hydroxy-2,3-diphenylbutanoic acid,
(ii) 4-amino-3-pentadecylphenol,
(iii) 3-(hydroxyimino)-2,4-diphenylbutanenitrile and
(iv) 2-ethyl-1,2-diphenylbutyl carbamate
Using these four ligands Docking studies were performed using GOLD to evaluate the best docked ligand (Figure 6).
Since the results depend on the choice of scoring functions obtained in GOLD (Table 2), an analysis was performed based on the ligand binding score greater than 50. Also, there was no overlap between the top-scoring compounds from protein–ligand versus ligand-based scoring (Table 2). The small molecules which we determined involved compounds with similar chemical structures, similar modes of action, or drug interactions.
Discussion :
The biological activity of the all four best fit predicted molecules is very poorly documented in several databases including ‘The Bibra Toxicity Profiles’ which documents critical reviews on the most pertinent toxicological data published on commercially important chemicals. Also, FDA and FDA poisonous plant database did not list these compounds. Only one compound has been listed in pubchem as anticancer drug (3-hydroxy-2,3-diphenylbutanoicacid). The molecule 3-hydroxy-2,3-diphenyl butanoic acid- was shown as anticancer drug in vivo model, [NCI] data in mice tumor model L1210 Leukemia (intraperitoneal) in B6D2F1 (BDF1) mice
Conclusion :
However, our studies on these molecules showed these compounds as good candidates for anticancer activities. Therefore, our approach is valuable for drug discovery process and cancer therapy. Hence, now there is a need to study the pharmacological activity of these compounds in mice or in vivo models.
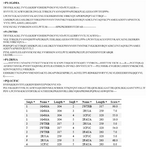
Figure 1. Alignment of the templates (PDB hit) used to generate 3D model:
a. Alignment shown in Clustal W Multiple Sequence Alignment (MSA) program
b. Alignment shown in Clustal W Multiple Sequence Alignment (MSA) score table
|
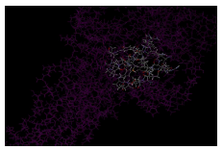
Figure 2. Showing the binding site view for I-TASSER model
|
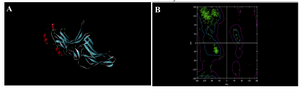
Figure 3. Secondary structure and Ramachandran plot view of the model by modeler9v8
|
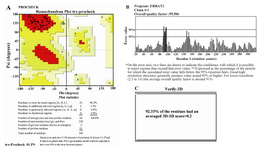
Figure 4. Model evaluation by SAVES server. A) Ramachandran plot procheck, B) ERRAT Program, C) Verify_3D program
|
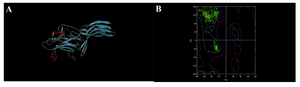
Figure 5. Model generated after optimization using steepest descent (1000) and conjugate gradient(5000) algorithm using GROMACS
|
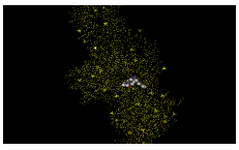
Figure 6. After docking the similar ligands, totally four ligands were shown to bind with gold score greater than 50. All the four ligands, were docked to minimized structure using GOLD and the best ligand with top scores interaction is shown below
|
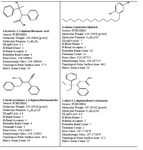
Table 1. Molecule description
|
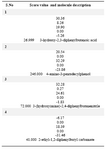
Table 2. Chemscore based interactions of molecules docked into the active site of thioredoxin
|
|