A Motif-Based Network Analysis of Regulatory Patterns in Doxorubicin Effects on Treating Breast Cancer, a Systems Biology Study
-
Dehghan , Zeinab
-
Student Research Committee, Department of Medical Biotechnology, School of Advanced Technologies in Medicine, Shahid Beheshti University of Medical Sciences, Tehran, Iran
-
Cellular and Molecular Biology Research Center, Shahid Beheshti University of Medical Sciences, Tehran, Iran
-
Mirmotalebisohi, Seyed Amir
-
Student Research Committee, Department of Medical Biotechnology, School of Advanced Technologies in Medicine, Shahid Beheshti University of Medical Sciences, Tehran, Iran
-
Cellular and Molecular Biology Research Center, Shahid Beheshti University of Medical Sciences, Tehran, Iran
-
Sameni, Marzieh
-
Student Research Committee, Department of Medical Biotechnology, School of Advanced Technologies in Medicine, Shahid Beheshti University of Medical Sciences, Tehran, Iran
-
Cellular and Molecular Biology Research Center, Shahid Beheshti University of Medical Sciences, Tehran, Iran
-
Bazgiri, Maryam
-
Department of Animal Science, Agriculture and Natural Resources University of Khuzestan, Ahvaz, Iran
-
 Zali, Hakimeh
Department of Tissue Engineering and Applied Cell Sciences, School of Advanced Technologies in Medicine, Shahid Beheshti University of Medical Sciences, Tehran, Iran, Hakimehzali@gmail.com
Zali, Hakimeh
Department of Tissue Engineering and Applied Cell Sciences, School of Advanced Technologies in Medicine, Shahid Beheshti University of Medical Sciences, Tehran, Iran, Hakimehzali@gmail.com
-
Department of Tissue Engineering and Applied Cell Sciences, School of Advanced Technologies in Medicine, Shahid Beheshti University of Medical Sciences, Tehran, Iran
Abstract: Background: Breast cancer is the most common malignancy worldwide. Doxorubicin is an anthracycline used to treat breast cancer as the first treatment choice. Never-theless, the molecular mechanisms underlying the response to Doxorubicin and its side effects are not comprehensively understood so far. We used systems biology and bio-informatics methods to identify essential genes and molecular mechanisms behind the body response to Doxorubicin and its side effects in breast cancer patients.
Methods: Omics data were extracted and analyzed to construct the protein-protein interaction and gene regulatory networks. Network analysis was performed to iden-tify hubs, bottlenecks, clusters, and regulatory motifs to evaluate crucial genes and molecular mechanisms behind the body response to Doxorubicin and its side effects.
Results: Analyzing the constructed PPI and gene-TF-miRNA regulatory network showed that MCM3, MCM10, and TP53 are key hub-bottlenecks and seed proteins. Enrichment analysis also revealed cell cycle, TP53 signaling, Forkhead box O (FoxO) signaling, and viral carcinogenesis as essential pathways in response to this drug. Besides, SNARE interactions in vesicular transport and neurotrophin signaling were identified as pathways related to the side effects of Doxorubicin. The apoptosis in-duction, DNA repair, invasion inhibition, metastasis, and DNA replication are sug-gested as critical molecular mechanisms underlying Doxorubicin anti-cancer effect. SNARE interactions in vesicular transport and neurotrophin signaling and FoxO signaling pathways in glucose metabolism are probably the mechanisms responsible for side effects of Doxorubicin.
Conclusion: Following our model validation using the existing experimental data, we recommend our other newly predicted biomarkers and pathways as possible mole-cular mechanisms and side effects underlying the response to Doxorubicin in breast cancer requiring further investigations.
Introduction :
Breast cancer is the most common cause of cancer and mortality caused by cancers in women worldwide 1. Four subtypes of this cancer include luminal A and luminal B [expressing the Estrogen Receptor (ER)], basal-like, and Human Epidermal growth factor Recep-tor 2 (HER2)-enriched (without ER expression). This cancer is a heterogeneous disease at the molecular level. The characterization influence biologically-directed therapies and treatment de-escalation 2. Breast cancer is often curable early, but the metastatic form is almost mortal due to therapeutic resistance 3. The estrogen hormone and its receptor play essential roles in breast cancer progression. The dysregulation of the Estrogen Receptor (ER) is attributed to two-thirds of all breast cancers. The ER receptor is one of the therapeutic targets for ER+ breast cancer 4. In clinical diagnosis, 75% of breast tumors are ER+ 5; however, the role of ER signaling in metastasis of breast cancer remains poorly understood. Several studies have shown an adverse effect of ER signaling on motility and invasion of cells 6,7, while a few studies suggested a positive effect of ER signaling on motility and invasion 8,9.
Doxorubicin (DXR) is an anthracycline and chemo-therapeutic drug isolated from Streptomyces peucetius 10. This drug is used to treat several cancers, including breast, gastric, lung, ovarian, thyroid, sarcoma, non-Hodgkins and Hodgkins lymphoma, multiple myelo-ma, and pediatric cancers 11,12. DXR induces Reactive Oxygen Species release (ROS) that ROS lead to DNA damage, lipid peroxidation and membrane damage, and apoptotic cell death pathways 13. DXR is among the chemotherapy drugs approved to treat ER+breast can-cer. The response rates to DXR in patients exposed to DXR for the first time is reported to be 48%, and for more than once is 28% 14. Nevertheless, little is known about the molecular basis of its effect on cell pro-liferation, estrogen/estrogen receptor signaling, and cell cycle progression 15-17. Some investigations have even reported cardiotoxic side effects for DXR that their molecular mechanisms remain to be deciphered in detail 18.
Systems biology and network-based methods are recently used to decipher the molecular mechanisms behind drugs and their possible side effects. Several such studies rely on network topology analysis to identify the effect of chemotherapy on various cancers. These networks can help understand how drugs influence the disease at the molecular level and identify the crucial gene sets underlying various drug effects 19-22. Several network analysis studies of drug-disease associations have been used to predict drug side effects with high accuracy. Global expression data-based computational approaches can utilize gene interaction information for modeling Protein-Protein Interaction Networks (PPINs) and Gene Regulatory Networks (GRNs).
Identifying network modules and their biological functions helps decipher the molecular mechanisms of drug effects, identify new drug targets, predict body response to drugs, and organism behavior 23-25. Gene regulatory networks contain information about regulatory elements of gene expression. These networks can identify regulatory programs and help understand the molecular basis of drug pharmacodynamics and even pharmacogenetics 26. In 2020, a study analyzed the gene regulatory network of breast cancer and identified gene-specific personalized drug treatments 27. Rao Zheng et al also constructed a gene regulatory network of diabetic nephropathy; they recognized essential genes using this method. These findings provide targets for drug development 28. Adel Aloraini et al, in 2018, performed the identification of breast anti-cancer Docetaxel drug targets (DAXX and FGR1) using analysis of gene regulatory network and molecular docking 29.
Molecular mechanisms mediating in breast cancer treatment by DXR and the mechanisms underlying its side effects are not still comprehensively understood. Therefore, in this study, we used protein-protein interaction and gene regulatory networks to identify essential molecular mechanisms and biological functions in response to DXR and the molecular mechanisms responsible for its side effects. We utilize a systems biology approach and bioinformatics analysis of protein-protein interaction network and Gene Regulatory Networks (GRNs) on omics data of breast cancer treatment using the DXR chemotherapeutic agents. Here, we utilize the protein-protein interaction modules and gene regulatory network motifs to predict and identify drug targets, Gene Ontology (GO) and biochemical pathways mediating in response to ER+ breast cancer and mechanisms underlying its side effects.
Materials and Methods :
Data collection
Datasets on breast cancer (MCF-7 cell)/DXR were searched and collected from the Gene Expression Omnibus (GEO) database (http://www.ncbi.nlm.nih.gov/ geo/) and proteomic publications 30,31. Three datasets (GSE124597 (GPL 15207), GSE39870 (GPL 571), and GSE13477 (GPL 570) were selected to compare breast cancer (MCF-7 cell line)/DXR and non-treatment breast cancer (MCF-7 cell line) for analysis in this study. Figure 1 shows the workflow of this study.
Raw data processing and Data analysis
The datasets' Differentially Expressed Genes (DEGs) were analyzed and identified using GEO2R (https://www.ncbi.nlm.nih.gov/geo/geo2r/), which nor-malized the data using the GEO query and limma R package. The differentially expressed genes were identified according to p-value<0.05 and Fold Change cut-off of >0.5 and <-0.5 as a threshold. The genes obtained from the three datasets and proteomic publications (mass spectroscopy on MCF-7 treated compared to untreated) were used for further analysis.
Protein-protein interaction network construction
The shared DEGs between the three GSE datasets were obtained using the Venn diagram Tool 32 and unioned with DEGs data extracted from proteomic publications. We applied the STRING (Search Tool for the Retrieval of Interacting Genes/Proteins, https://string-db.org) with a confidence score of more than 0.7 and Bisogenet app [Human Protein Reference Database (HPRD)] to map the interactions of DEGs obtained from the shared bodes among the three GSE DEGs and unioned with proteomic publications. STRING is a biological database of known and predicted protein-protein interaction (physical and functional) for many organisms 33. Bisogenet could build a relation between genes and their products in a fast and user-friendly manner and has multiple applications, including genomics information, protein-protein interactions, protein-DNA interactions, and gene ontology 34. Bisogenet is available in Cytoscape software.
Topological network analysis
The PPI networks obtained from STRING and Bisogenet app were merged using Cytoscape software to analyze the interactions and connections between proteins (http://www.cytoscape.org/). Cytoscape software in bioinformatics for visualizing biomolecular interaction networks (protein-protein, protein-DNA, and genetics interactions) was available for humans and model organisms 35.
This software contains several plugins for functional analysis in PPI networks. Cytoscape network analyzer is a tool that determines the degree and betweenness-centrality of every node as the hub and bottleneck genes. The hubs are node proteins with many interactions, and bottlenecks are nodes with high betweenness centrality 35,36. Finding PPIN hubs and bottlenecks is used to candidate drug targets when drug designing. Besides, it is used to candidate possible disease markers 37,38. We selected the top 10% of nodes with a higher degree and betweenness as hub-bottlenecks for further analysis.
Molecular complex detection (MCODE) cluster sub-networks
The STRING and Bisogenet PPI (HPRD database) networks were merged, and the resulted network was used to identify clusters using the MCODE Plug-in. The MCODE algorithm, one of the Cytoscape plugins, was used to identify highly interconnected sub-net-works with parameter settings, including Degree Cutoff=2, Node Score Cutoff=0.2, K-Core=2, and Max-Depth=100 39. We considered the MCODE score>3 and the number of nodes>10 as the final clusters' cut-off criteria.
Functional enrichment analysis for hub-bottlenecks and MCODE clusters
The enrichment analysis for Biological process, molecular function, and cellular component and KEGG biochemical pathways (Kyoto Encyclopedia of Genes and Genomes) were performed for the top 10% of the hub and bottleneck genes using the DAVID Tool (Database for Annotation, Visualization, and Integrated Discovery; https://david.ncifcrf.gov/). DAVID is a bio-informatics resource for functional interpretation of a list of genes and can identify GO terms and visualize genes on the KEGG pathway 40. The functional enrichment analysis was then performed for pathways of the sub-networks using the STRING database. For the enrichment analysis, STRING uses known systems such as Gene Ontology and KEGG 41.
TF-miRNA-gene regulatory networks Construction (for UP and down-regulated DEGs)
The up and down-regulated DEGs among the three GSE datasets were identified separately using Venn diagram Tool 32. The identified shared DEGs were unioned with up- and down-regulated proteins retrieved from proteomic publications results, separately. These up- and down-regulated genes were finally used to construct two separate regulatory networks for up- and down-regulated DEGs. The four relationships, including TF-gene, TF-miR, miR-gene, miR-TF, were extracted using the following tools and database to construct two gene regulatory networks for the gene sets.
MiRNAs regulating DEGs
The miRTarBase (http://miRTarBase.mbc.nctu.edu. tw/) and miRecords (http://c1.accurascience.com/mi-Records/) databases were used for identifying miRNAs regulating genes and transcription factors. MiRecords is a database of experimentally validated miRNA-target interaction 42. Besides, miRTarBase is a curated database of experimentally validated miRNA targets with high quality, and its miRNA-target interactions data are collected by receptor assay, microarray, next-generation sequencing, and western blot 43.
Transcription factors regulating DEGs
The TFs regulating our target genes were extracted from the TRANSFAC (TRANScription FACtor; https: //genexplain.com/transfac/) and TRRUST databases (transcriptional regulatory relationships unravelled by sentence-based text-mining; https://www.grnpedia.org/ trrust/). TRANSFAC is a database of eukaryotic transcription factors and their experimentally-proven binding sites 44. TRRUST is a curated database of human and mouse transcriptional regulatory networks, including 8444 TF-target interactions for 800 TFs in humans and 6552 regulatory interactions for 828 mouse TFs 45.
miRNAs inhibiting TFs
The TFs regulating our target genes were fed into the miRTarBase and miRecords databases to obtain miRNAs targeting TFs.
TFs regulating miRNAs
For identifying TFs regulating miRNAs, we used the TransmiR database (http://www.cuilab.cn/trans-mir). This database contains 3730 TF-miRNA regulations among 19 species from 1349 reports manually curated by surveying >8000 publications and more than 1.7 million tissue-specific. TF-miRNA regulations incorporated based on ChIP-seq data 46.
Network construction, motif detection and motif specific sub-networks generation
In a gene regulatory network, network motifs are composed of nodes and regulations that connect the nodes. Some of these regulatory interaction patterns may be significantly high in some networks 47. The molecular interactions of motifs are necessary to understand each motif's biological function 48. To find the regulatory motifs in up-regulated and down-regulated gene networks, we used FANMOD software. The regulatory relationships (TF-miRNA, TF-Gene, miRNA-Gene, and miRNA-TF) were fed into the FANMOD to identify the motifs with three nodes. FANMOD is a tool for network motifs detection with detection motifs in a big network and analyzes colored networks 49. This tool was used to build random networks 1000 times and compared it with the original input network. When randomizing the network in a constant global model, they indicate the frequency of motifs observed in the real network minus the mean of their occurrence in the random network divided by the standard deviation. The motifs with Z-score>2.0 and p-value <0.05 were selected as the significant motifs. TFs, genes and miRNAs participating in each motif were detected. The motif-related sub-networks of the up- and down-regu-lated DEGs were then merged (union) in Cytoscape software 3.5.1, separately. Finally, the top 10% of nodes with the highest degree (hub) and betweenness centrality (bottlenecks) were identified in the new networks, separately.
Functional enrichment analysis of GRN
The up- and down-regulated DEGs of motif-related sub-networks were selected for functional enrichment analysis. The sets of DEGs participating in the union of the up- and down-regulated motif-related sub-networks were enriched by the DAVID Tool. The GO terms with p-value <0.05 were selected as significant.
Results :
Raw data gathering and analysis
A total of 320 DEGs, including 126 up- and 194 down-regulated genes, were retrieved after analysing the datasets (GSE124597, GSE39870, and GSE1347) and collecting proteomics publications data. Supplementary figure 1 shows the resulted Venn diagram. Supplementary table S1 represents all the up- and down-regulated DEGs
Construction of PPI network
The PPI network was constructed for DEGs using STRING and Bisogenet app (HPRD database) for map-ping interactions and then merging. The resulted network consisted of 320 nodes and 2519 edges.
Topological analysis
The network analyzer tool was used to study the topological network properties and identify the crucial hub and bottleneck nodes. The topological network properties included the clustering coefficient of 0.385, the shortest path of 60362, network density of 0.045, and diameter of 7. Figure 2 represents a sub-network including the 10% of the genes with the highest degree and betweenness centrality as hubs and bottlenecks, respectively. The top ten hubs and bottlenecks are listed in table 1. The list of 10% of the genes with the highest degree and betweenness centrality are reported in Supplementary table S2.
Module detection
Further analysis of complexes by MCODE app in Cytoscape software revealed 13 sub-networks. The PPI sub-networks are highly connected regions of the network. Three sub-networks were selected according to score>3 and nodes>10 (Table 2, Figure 3). The seed nodes of these sub-networks included MCM10 (Minichromosome Maintenance 10 Replication Initiation Factor) for sub-network No.1, MCM3 (Minichromosome Maintenance 3 Replication Initiation Factor) for sub-network No.2, and NAPRT (Nicotinate Phosphoribosyltransferase) for sub-network No.3. The results are depicted in table 3. The nodes related to sub-networks are shown in Supplementary table S3.
Gene ontology and KEGG pathway enrichment
We performed Gene Ontology analyses for 10% of hubs and bottleneck genes using the DAVID database. Table 4 shows the resulting gene ontology terms. Biological process terms reveal that most of the hub genes participate in regulating the cell cycle. The top 10 related molecular functions identified using the DAVID database mediated in protein binding, nucleic acid-binding, etc. The cellular component terms showed that most hub genes were present in the cytoskeleton, chro-mosomes, etc.
The DAVID database's KEGG pathway analysis demonstrated that hub and bottleneck genes were involved in the cell cycle, Tumor protein 53 (Tp53) signaling pathway, viral carcinogenesis, viral infections, Forkhead box O (FoxO) signaling pathway, and adherent junctions. Besides, the KEGG pathway analysis showed that SNARE interactions in vesicular transport and neurotrophin signaling pathway were of a significant p-value in enrichment. They could be hypothesized and studied as a signaling possibly related to some side effects of DXR. Table 4 contains the top results of the KEGG pathway analysis by the DAVID database. Supplementary table S4 contains all gene ontology and pathways data related to 10% hub and bottleneck genes.
The top pathway terms significantly enriched in sub-network No.1 included the cell cycle, p53 signaling pathway, viral carcinogenesis, FoxO signaling pathway, and DNA replication. Biochemical pathways involved in sub-network No.2 included cell cycle and DNA replication. The nodes in sub-network No.3 were related to viral carcinogenesis (Table 3).
TF-miRNA-gene regulatory network construction
Identification of miRNA-gene/TF and TF-miRNA/gene interactions: In this study, miRNAs regulating post-transcriptional mRNAs were retrieved from the two experimentally validated databases, including miRTar-Base and miRecords. The up-regulated genes obtained from three GSE and proteomics data were targeted with 1082 miRNAs through 2103 interaction, and the transcription factors regulating genes were identified using TRANSFAC and TRRUST databases. The results revealed that 227 TFs regulated the target genes through 1088 interactions. The number of 1444 miRNAs targeted 152 TFs with 5979 interactions. TFs regulating miRNAs identified by the validated data of the TransmiR database revealed 356 TFs regulated 323 miRNAs with 2011 interactions.
The 194 down-regulated genes obtained from the three GSE datasets and proteomics data were regulated by 1027 miRNAs and 209 TFs through 2457 and 1458 interactions. The number of 1451 miRNAs targeted 133 TFs with 5862 interactions. The analysis of TFs regulating miRNAs by TransmiR revealed that 354 TFs regulated 320 miRNAs with 2008 interactions obtained from experimentally validated data. Finally, the miRNA-gene, TF-Gene, miR-TF, and TF-miR interactions were incorporated to construct two regulatory networks in Cytoscape. The results are shown in table 5. Supplementary table S5 and table S6 contain all relationships in up-regulated and down-regulated, respectively.
Motif detection and generating motif-specific sub-networks
The miRNA-gene, TF-Gene, miRNA-TF, TF-miRNA relationships were combined, and the regulatory networks were constructed. The up- and down-regulated gene networks contained 2250 and 2251 nodes, respectively. The FANMOD software was used to detect the motifs. The types of identified motifs are represented in figure 4 for up- and down-regulated gene networks.
We selected motifs with Z-score>2, p-value<0.05, and at least two-color edges (two types of interactions). Motifs with identification numbers 14, 78, and 164 were finally selected in the up-regulated network. The sub-networks related to these motifs were merged to create a network, including 64 miRNAs, 53 genes, and 321 TFs. The regulatory sub-networks were visualized by Cytoscape 3.5.1. (Figure 5A). Motifs No.78 and 164 were selected and merged in the down-regulated network to create a sub-network including 77 miRNAs, eight genes, and 274 TFs (Figure 5B).
The topological analysis of up and down-regulated GRNs identified the BTG Anti-Proliferation Factor 2
(BTG2), Specificity Protein 1 (SP1), and TP53 as hub-bottleneck, which were also present in up-regulated sub-network. However, none of the genes in the down-regulated sub-network was among the GRN 10% of hub-bottlenecks.
Gene ontology and biochemical pathway enrichment analysis
For Gene Ontology analysis, genes obtained from motif detection were submitted in the DAVID database. The top 10 Biological process terms included regulation of cell death and the metabolic process, nucleic acid-binding, transcription binding are top 10 in molecular function terms. The cellular components showed the nucleus and organelle as the top related to the gene-set. The significant pathways were identified from analysis of genes in motif-related sub-networks using the DAVID database. The significant pathways included the p53 signaling pathway, transcriptional misregulation in cancer, cell cycle, PI3K-Akt signaling pathway, viral carcinogenesis, viral infection, Measles, and FoxO signaling pathway (Table 6). Supplementary table S7 contains all gene ontology and KEGG pathways data related to the gene set.
Discussion :
Breast cancer is the most common malignancy in women. Its molecular heterogeneity influences the selection of methods in the effective treatment of this cancer 2. Treatment of routine surgery, radiation therapy, chemotherapy, stabilizing agents, enzyme inhibitors, and immunotherapy are used to treat breast cancer. DXR is an effective chemotherapeutic drug of the anthracycline family used to treat breast cancer 50. A comprehensive understanding of the molecular mechanisms of DXR in the treatment of breast cancer is still lacking 51. The systems biology approach and bioinformatical network analysis for breast cancer in response to DXR help candidate essential genes and pathways mediating in response to this drug for further experimental examinations. The identified and validated targets and pathways may even be used to repurpose new drugs.
Network-based approaches have recently appeared to be a powerful tool to investigate pathobiological processes and the molecular complexity of disease aetiology by identifying disease-specific network clusters such as MCODE clusters in PPI networks. The nodes participating in these particular regions usually have critical roles and biological functions 52. Nodes participating in regulatory motifs also are of biological importance in GRNs 53. We applied the MCODE clusters and GRN motifs to predict the molecular mechanisms underlying the treating effect of DXR on breast cancer and its side effects. This study selected genomics and proteomics data to integrate and explore critical genes and molecular pathways. The present study is the first in silico analysis that uses bioinformatics analysis to predict the essential genes and pathways of breast cancer treated with DXR and its side effects.
Our systematic analysis of the PPI MCODE clusters and GRN motif-related sub-networks of the MCF7 cell line in response to DXR demonstrated that TP53, MCM10, and MCM3 are the top hub-bottlenecks and MCODE cluster seeds in response to DXR (Supplementary table S8). The functional enrichment analysis indicated that hub-bottleneck and cluster nodes were involved in the cell cycle, P53 signaling pathway, FoxO signaling pathway, and viral carcinogenesis.
TP53 is a hub-bottleneck protein in our PPIN and GRN. TP53 is a gene with a high degree and betweenness centrality over-expressed in the MCF-7 cell line in response to DXR. This protein can recognize DNA damage, stop the cell cycle at the G1/S regulation point, and activate DNA repair proteins. Therefore,
TP53 can initiate apoptosis if DNA damage is irreparable 54. TP53 was up-regulated in MCF-7 cells treated with DXR. Therefore, it can be concluded that DXR activates the repair system and instigates apoptosis in cancer cells possible through P53 mediation.
The Minichromosome Maintenance proteins (MCM) are critical regulators in DNA replication 55. These proteins are implicated in cancer initiation and progression, and their expression is up-regulated in a wide range of epithelial malignancies 56. MCM10, an MCM family member, is an essential factor for DNA replication by binding with Cell Division Cycle 45 (CDC45) and is essential in breast cancer progression 57. Alcivar AL et al reported that cells depleted of MCM10 showed instability of replication fork 58. Wei‐Dong Yang et al in 2019 showed MCM10 was significantly over-expressed in breast carcinoma and involved in proliferation, migration, and invasion. Therefore, it can induce metastasis via the Wnt/β-catenin pathway in breast cancer 59. Our results identified MCM10 as a critical node in the network. Given the importance of this protein and the lack of experimental literature about its mediation in response to DXR, we suggest that its experimental investigation seems necessary.
MCM3, another MCM member, is over-expressed in various human cancers 60. MCM3 is one of the cell cycle markers that regulates the growth, migration, and invasion of cells 61. Our study showed that MCM3 was also a down-regulated protein of importance in the networks. Therefore, we hypothesize that DXR can probably inhibit DNA replication, invasion, and metastasis by down-regulating the MCM10 and MCM3 genes.
The functional enrichment analysis showed regulation of the cell cycle, p53 signaling, viral carcinogenesis, Human T-Lymphotropic Virus type 1 (HTLV-1) infection, and FoxO signaling pathway were the top terms related to hubs and bottlenecks in PPIN, MCODE clusters, and GRNs. Besides, Soluble N-ethylmaleimide-sensitive factor Attachment protein Receptor (SNARE) interactions in vesicular transport and neurotrophin signaling pathway were identified in our PPIN KEGG pathway results that could be related to side effects of DXR.
Deregulation of the cell cycle is one of the mechanisms involved in the malignant phenotype of cancer. Regulation of the cell cycle can be used as a therapeutic targeting strategy against cancer 62. The chemotherapeutic agent DXR can cause cell arrest in the G1-phase of the cell cycle 63. In addition, Kim HS et al in 2009 reported that this drug could induce intracellular apoptotic signaling through up-regulation of Fas expression 64.
Viral carcinogenesis and HTLV-1 infection were other pathways related to hubs and bottlenecks enrichments. The virus has known oncogenic potential in specific cancers, including the cervix, liver, head and neck, some lymphomas, and breast cancer 65. HTLV-1 is one of the viruses that encode oncogenic protein Tax1 Binding Protein 1 (TAX1) and help breast cancer progression 66. TAX1 protein can inactivate the function of cellular TP53 and postpone the G1 cell cycle arrest required for repairing DNA in response to DNA damage 67. DXR can induce apoptotic cell death in HTLV-1 infected cells 68.
Our model identified that the P53 signaling pathway was a significantly enriched KEGG pathway related to hub-bottlenecks and MCODE clusters. McSweeney et al in 2019 reported TP53 as a critical regulator of transcriptomic changes induced by DXR 69. Ru-Wei Lin et al in 2018 showed DXR-induced apoptosis in response to DNA damage by overexpression of TP53 70. In addition, p53 interferes in cell metabolism, ferroptosis, autophagy, and generation of ROS 71. These validate the predictions performed by our model and justify performing experimental examinations on its other findings.
The FoxO signaling pathway was another identified signaling predicted by the model. FoxO transcription factors are tumor suppressors that mediate redox homeostasis, proliferation, survival, and Phosphatidylinositol-4,5-Bisphosphate 3-Kinase (PI3K) 72. Rosaline CY et al. reported that the cancer treatment with DXR increased FOXO3a activity 73. During apoptosis, FOXOs are involved in expressing death receptor ligands such as Fas ligand, TNF, Bim, bNIP3, and Bcl-XL 74. The enhanced FOXO3a activity increased the expression of ABCB1, a plasma membrane P-glycopro-tein, which functions as an efflux for various anti-cancer agents 73. FOXO proteins play an essential role in glucose homeostasis by promoting gluconeogenic enzyme expression 75. The dysfunction of FoxO1 pathways involves several metabolic diseases, including atherosclerosis, diabetes, non-alcoholic fatty liver disease, and obesity 76. Notably, FOXO proteins are involved in physiological processes. Activation and inhibition of these proteins could have intolerable side effects.
Other signaling pathways significantly enriched in our study were SNARE interactions in vesicular trans-port and neurotrophin signaling pathway. SNAREs are a group of transmembrane proteins which create a bridge for interaction vesicle to its fusion partner. This vesicle trafficking is regulated by a separate process and stimulates the SNARE complex formation 77. The dysfunction of membrane trafficking is associated with cardiovascular events 78. DXR disrupts the trafficking membrane by reducing Syntaxin 17 (STX17), Syntaxin 16 (STX16), and Synaptosome Associated Protein 29 (SNAP29) protein expression, thereby probably having side effects on the heart in this way. Besides, neurotrophins and their receptors are regulatory factors in heart and vascular development. These molecules regulate angiogenesis and vasculogenesis, controlling the survival of endothelial cells, vascular smooth muscle cells and cardiomyocytes 79. Therefore, DXR may lead to cardiotoxicity through dysfunction of the neurotrophin signaling pathway with a change in expression of Glycogen Synthase Kinase 3 Beta (GSK3B), Mitogen-Activated Protein Kinase 1 (MAPK1), TP53, and Ras Homolog Family Member A (RHOA) proteins. In addition, the SNARE complex is vital in the formation of vesicle fusion, vesicle recycling and neurotransmitter release. The defects in the formation of the SNARE complex, SNARE-dependent exocytosis, and SNARE-mediated vesicle fusion are associated with neurological diseases 80.
Altogether we suggest that DXR regulates repair, apoptosis, invasion and metastasis of breast cancer cells. Its side effects are probably mediated by SNARE interactions in vesicular transport and neurotrophin signaling pathway and FoxO signaling pathway through up- and down-regulated genes primarily identified in our model. Further studies in vitro and in vivo are required to validate some of our novel findings.
Conclusion :
This study applied a network-based approach (PPIN and GRN) to reveal the network hubs and bottlenecks and 3-nodes motifs consisting of TFs, miRNAs, and target genes underlying the DXR effect on breast cancer. We identified the molecular mechanisms and path-ways mediating in response to DXR treatment. The hubs and bottlenecks of PPIN and GRN and PPIN MCODE clusters of differentially expressed genes in the MCF-7 cell line treated with DXR revealed that the essential biological processes and pathways are related to cell cycle, p53, viral carcinogenesis, and FoxO signaling pathway. Besides, SNARE interactions in vesicular transport and neurotrophin signaling pathway and FoxO signaling pathway were identified as pathways possibly mediating in its side effects. MCM10 and MCM3 were identified as essential DEGs mediating in response to DXR and are recommended for further investigations since their role is not studied sufficiently so far. We hope that our analysis results can understand the mechanisms involved in response to DXR and its side effects and help design further experimental investigations.
Acknowledgement :
This study is related to project NO.1398/10193 from the Student Research Committee, Shahid Beheshti University of Medical Sciences, Tehran, Iran. We also appreciate the "Student Research Committee" and "Research and Technology Chancellor" in Shahid Beheshti University of Medical Sciences for their financial support of this study.
Conflict of Interest :
The authors declare no conflicts of interest.
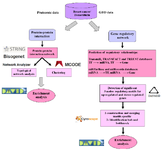
Figure 1. Study workflow.
|
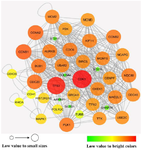
Figure 2. Protein-protein interaction network. The sub-network constructed by Cytoscape software encompasses 10% of hubs and bottlenecks. The nodes' size and color are based on their degree value, and Nodes with dark color (red) have the highest degree.
|
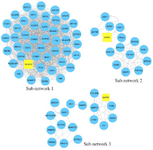
Figure 3. The PPI sub-networks based on highly connected-regions. Sub-networks 1, 2, and 3 were selected based on Score>3 and nodes> 10. Yellow rectangles represent seed nodes.
|
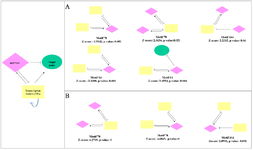
Figure 4. Regulatory motifs consist of miRNAs, TFs, and target genes detected in up and down-regulated gene networks with their Z-score and their p-value. Three types of relationships involved in these motifs included miRNA-gene (miRNA represses gene expression); miRNA-TF (miRNA represses TF gene expression); and TF-miRNA (TF regulates miRNA expression).
|
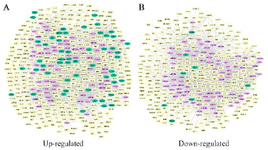
Figure 5. Regulatory sub-networks. A) The sub-network was generated by merging motifs No.14, 78, and 164 in the up-regulated gene network. B) Merging motifs No.78 and 164 in the down-regulated network. Pink diamond nodes are miRNAs, green circular show genes, and yellow rectangles represent the transcription factors.
|
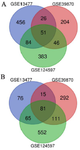
Supplementary Figure S1. Venn diagram for DEGs of GEO datasets (GSE124597, GSE39870, and GSE13477) related to MCF-7 cell line treated with doxorubicin. A) Venn diagram related to up-regulated genes B) Venn diagram related to down-regulated genes.
|
Supplementary Table S1. Up/Down-regulated proteins are represented below
|
Supplementary Table S2. Hubs and bottlenecks (top 10%) related to PPI network obtained by Cytoscape software.
|
Supplementary Table S3. Each column represents proteins available in one MCODE cluster
|
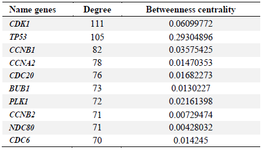
Table 1. Hub genes related to the breast cancer-doxorubicin network obtained from Cytoscape software
|
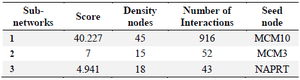
Table 2. The PPI sub-networks with Score>3 and nodes>10.
|
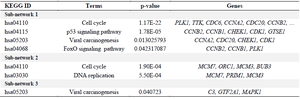
Table 3. KEGG pathway analysis of sub-networks.
|
Table 4. Top 10 biological processes, molecular functions, cellular components, and KEGG pathways of 10% hub and bottleneck genes identified using the DAVID database (sorted based on p-value <0.05)
|
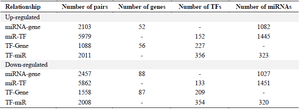
Table 5. Summary of four types of regulatory relationships among miRNA-gene, TF-Gene, miR-TF, and TF-miR interactions
|
Table 6. The table represents the top 10 biological processes, molecular function, cellular components, and KEGG pathways identified using the DAVID tool (sorted based on p-value<0.05)
|
|