Production of PEGylated G-CSF from non-classical inclusion bodies expressed in Escherichia coli
-
Thi My Trinh, Nguyen
-
Department of Molecular and Environmental Biotechnology, University of Science, Ho Chi Minh City, Vietnam
-
Vietnam National University, Ho Chi Minh City, Vietnam
-
Linh Thuoc, Tran
-
Department of Molecular and Environmental Biotechnology, University of Sciencee, Ho Chi Minh City, Vietnam
-
Vietnam National University, Ho Chi Minh City, Vietnam
-
 Thi Phuong Thao, Dang
Vietnam National University, Ho Chi Minh City, Vietnam, Tel/Fax: +84 90 9420355; E-mail: dtpthao@hcmus.edu.vn
Thi Phuong Thao, Dang
Vietnam National University, Ho Chi Minh City, Vietnam, Tel/Fax: +84 90 9420355; E-mail: dtpthao@hcmus.edu.vn
-
Department of Molecular and Environmental Biotechnology, University of Science, Ho Chi Minh City, Vietnam
Abstract: Background: The recombinant human granulocyte colony stimulating factor conjugated with polyethylene glycol (PEGylated GCSF) has currently been used as an efficient drug for the treatment of neutropenia caused by chemotherapy due to its long circulating half-life. Previous studies showed that Granulocyte Colony Stimulating Factor (GCSF) could be expressed as non-classical Inclusion Bodies (ncIBs), which contained likely correctly folded GCSF inside at low temperature. Therefore, in this study, a simple process was developed to produce PEGylated GCSF from ncIBs.
Methods: BL21 (DE3)/pET-GCSF cells were cultured in the LiFlus GX 1.5 L bioreactor and the expression of GCSF was induced by adding 0.5 mM IPTG. After 24 hr of fermentation, cells were collected, resuspended, and disrupted. The insoluble fraction was obtained from cell lysates and dissolved in 0.1% N-lauroylsarcosine solution. The presence and structure of dissolved GCSF were verified using SDS-PAGE, Native-PAGE, and RP-HPLC analyses. The dissolved GCSF was directly used for the conjugation with 5 kDa PEG. The PEGylated GCSF was purified using two purification steps, including anion exchange chromatography and gel filtration chromatography.
Results: PEGylated GCSF was obtained with high purity (~97%) and was finally demonstrated as a form containing one GCSF molecule and one 5 kDa PEG molecule (monoPEG-GCSF).
Conclusion: These results clearly indicate that the process developed in this study might be a potential and practical approach to produce PEGylated GCSF from ncIBs expressed in Escherichia coli (E. coli).
Introduction :
Granulocyte Colony Stimulating Factor (GCSF) is a cytokine and hormone which affects the survival, proliferation, differentiation, mobilization, and func-tions of all cells along the neutrophil lineage, including neutrophil precursors and mature neutrophils 1. Due to the important roles in regulation of neutrophil numbers, GCSF, especially its recombinant forms, has been widely used for the treatment of neutropenia induced by cancer chemotherapy 2.
Recombinant GCSF has been recently produced from Escherichia coli (E. coli), Saccharomyces cerevi-siae (S. cerevisiae), and mammalian cells through genetic engineering 3-5. Among these expression sys-tems, E. coli is the most preferred host due to some
advantages such as low cost, high productivity, simple cultivation, and rapid growth 6. However, in E. coli cells, recombinant GCSF tends to be expressed as Inclusion Bodies (IBs), which are considered as inactive forms of proteins 7. To produce the bioactive GCSF, IBs must undergo a process of denaturation and refolding, which often results in poor recovery of protein and increases the cost of products. Moreover, it has been previously reported that when being cultured at low temperature, E. coli cells could produce GCSF in non-classical IBs (ncIBs), which contain a high percentage of correctly folded proteins inside 8,9. The ncIBs could be well dissolved in mild detergents, thus biologically active GCSF could be easily extracted under non-denaturing conditions. Without the require-ment of denaturation and refolding steps, this seems to be a time-saving and cost-effective approach for GCSF production.
Although the recombinant GCSF expressed in E. coli cells is an effective drug for neutropenia treatment, it has a short circulating half-life (3-4 hr) that requires daily administration to maintain the therapetic effects 10. Previous studies reported that the conjugation of GCSF to Polyethylene Glycol (PEG) could increase its circulating half-life up to 48 hr 11. Therefore, a single dose of PEGylated GCSF per chemotherapy circle is sufficient to prevent or manage neutropenia, that offers an advantage over the multiple daily administrations of GCSF 12.
Due to the aforementioned advantages of producing GCSF from ncIBs and GCSF PEGylation, a process was developed to produce PEGylated GCSF from ncIBs expressed in E. coli. The PEGylation can be performed using chemical or enzymatic methods 13. Among them, chemical methods, which covalently conjugate PEG at the ε-amino group of lysine residues by using acylating PEG derivatives, are often used. However, these methods induce the PEGylation in multiple sites of GCSF, thus result in the substantial heterogeneity of the PEGylated proteins 14,15. Recently, a very promising enzymatic method using Transgluta-minase (TGase) has been developed for covalently attaching PEG moieties at the γ-carboxamide group of glutamine residues, that allows controlling the size of them 16. Scaramuzza et al demonstrated that Tgase could catalyze the site-specific PEG conjugation to glutamin 135 of GCSF 17. However, in previous reports, the purified GCSF was used in a PEGylation reaction to obtain the PEGylated GCSF 16-18. By contrast, in our approach, the soluble GCSF was obtained by dissolving ncIBs in mild detergent solution and then directly used in PEG conjugation reaction mediated by TGase without a prior purification step that might minimize the number of steps and increase the yield of PEGylated GCSF production.
Materials and Methods :
Plasmid and strain: The g-csf gene construct was made based on mRNA sequence coding for the mature human GCSF (GenBank accession number NM_172219.2, bases 175-729). The sequence was optimized for efficient expression in E. coli using Gene Designer software. After that, the optimized sequence was ordered from Bio Basic Inc. (Toronto, Canada) using gene synthesis service. The g-csf gene was then inserted into plasmid pET-43.1a(+) (Novagen, US) between the restriction sites of BamHI and NdeI to construct plasmid pET-gcsf (Figure S1). The plasmid pET-gcsf was introduced into E. coli BL21 (DE3) cells (Novagen, US) to establish a recombinant strain, named BL21 (DE3)/pET-gcsf for GCSF production.
Fermentation in a 1.5 L bioreactor: BL21(DE3)/pET-gcsf cells were cultured over-night in a tube containing 5 ml LB medium (1% tryptone, 0.5% yeast extract, and 0.5% sodium chloride) supplemented with 100 µg/ml ampicillin at 37°C with reciprocal shaking (240 rpm). After that, 100 µl of the culture was transferred into an Erlenmeyer flask (1 L) containing 300 ml of medium A and the flask was inoculated at 37°C with reciprocal shaking (240 rpm) for 12-16 hr. One hundred milliliters of the secondary culture was subsequently transferred into the LiFlus GX 1.5 L bioreactor (Biotron, Korea) containing 1 L of medium B and then isopropyl b-d-1-thiogalactopyranoside (IPTG) was added at the final concentration of 0.5 mM to induce the expression of GCSF. The fermentation was started and controlled at 25°C, DO>20%, 250 rpm, and pH=7.0 for 24 hr. Ten milliliter samples were taken every 3 hr for measuring optical density (OD600) and verifying the expression of GCSF using western blot analysis. For SDS-PAGE and western blot analysis, cells from 1 ml of fermentation broth were collected by centrifugation, then resuspended into 250 µl of phosphate buffer (pH=7.4) and stored at -30°C until use. A similar fermentation but at 37°C was conducted to produce GCSF classical Inclusion Bodies (cIBs). The components of medium A and medium B are listed in table 1.
Preparation and dissolution of ncIBs: After 24 hr of fermentation, cells were collected, resuspended in lysis buffer (50 mM Tris-HCl pH=8.0, 1 mM EDTA, and 1 mM PMSF) with ratio of 10 ml per gram of wet weight of the cell pellet, and disrupted using M-110EH-30 Microfluidizer Processor. Insoluble fraction, which mainly contained ncIBs, was then obtained by centrifugation at 13.000 rpm, 4°C for 10 min. GCSF ncIBs were washed 3 times and then dissolved in 0.1% N- lauroylsarcosine solution with the ratio of 50 ml per gram of wet weight of IBs at 4°C with slight shaking for 16 hr. The sample was centrifuged at 13.000 rpm, 4°C for 30 min to collect the supernatant and pellet fractions. The pellet fraction was mixed well with miliQ so that the volumes of all fractions were equal. The presence of GCSF in all fractions was detected by SDS-PAGE analysis. The concentrations of GCSF in dissolved fractions were determined by Bradford protein assay.
Protein analysis: SDS-PAGE and western blot analyses: Ten microliters of each sample was mixed with 2.5 µl of SDS sample buffer (0.25% bromophenol blue, 0.5 M DTT, 50% glycerol, 10% SDS, and 0.25 M Tris-HCl pH=6.8). The mixture was incubated at 90°C for 5 min and applied into each well of a polyacrylamide gel (12%) for a SDS-PAGE analysis. Gels were stained using standard Coomassie Brilliant Blue staining method 19 or silver staining method 20. In western blot analysis, a monoclonal anti-GCSF antibody (R&D Systems, USA) and an anti-rabbit IgG, HRP-linked antibody (Piera, India), were used as primary and secondary antibodies to detect GCSF.
Native-PAGE: Ten µl of each sample (Containing 5 µg GCSF) was mixed with 2.5 µl of native sample buffer (4 mg bromophenol blue, 5 ml glycerol, 2.13 ml of Tris-HCl pH=6.8, and 9 ml H2O). The mixture was applied to a 6% native gel containing 3.5 ml H2O, 0.75 ml of 30% acrylamide/0.8% bisacrylamide, 1 ml of running buffer (30.29 g Tris and 7.73 g boric acid in 1 L H2O, pH=8.7), 45 µl of 10% ammonium persulfate solution, and 5 µl N,N,N,N-tetramethylethylenediamine. The gel was placed in running buffer and the Native-PAGE was carried out at 150 V until the dye line reached the bottom of the gel. The gel was then stained using silver staining method.
Reverse phase-HPLC: The reverse phase-HPLC (RP-HPLC) was carried out using an Inertsil WP300 C4 column 4.6×250 mm (GL Sciences Inc., Japan). The mobile phase consisted of buffer A (0.1% trifluoroacetic acid in acetonitrile) and buffer B (0.1% trifluoroacetic acid in water). The flow rate was maintained at 0.8 ml/min using a gradient program for 40 min (Table 2). Neupogen product was two-fold serially diluted to prepare the standard solutions with concentrations ranging from 18.75 µg/ml to 300 µg/ml. Twenty micrograms of standard solution or each sample was injected into the system for the analysis.
GCSF bioassay: M-NFS-60 cells (ATCC CRL-1838TM) were pre-cultured in RPMI medium supplemented with 10% FBS and 1 ng/ml GCSF (Neupogen, Switzerland). Cells were collected and washed 3 times with RPMI medium and resuspended in fresh RPMI medium at density of 105 cells/ml. A range of GCSF concen-trations from 10-2-106 pg/ml was prepared by diluting GCSF samples in RMPI medium. Next, 50 µl aliquot of cell suspension was seeded into each well of a microtiter plate, followed by adding 50 µl of each GCSF concentration. Plates were incubated for 48 hr at 37°C in 5% CO2 incubator. After that, 10 µl of Cell Counting Kit-8 (Merck, US) was added into each well of the plate. The plate was further incubated for 3 hr in an incubator and the absorbance was then measured at 450 nm (OD450) using Multiskan Ascent reader. ED50 values were determined using GraphPad Prism 8 solfware (www.graphpad.com). Since the specific activity of GCSF in Neupogen product is 1×10⁵ U/mg, the specific activity of GCSF sample was calculated by the following formula:
Specific activity (U/mg)=(ED50 of standard/ED50 of sample)×105.
PEGylation of GCSF: The dissolved GCSF was first changed to tested reaction buffers by overnight dialyzing of 50 ml sample against 2.5 L of each buffer at 4°C using a 3.5 kDa cutoff cellulose membrane (Funakoshi, Japan). The protein samples were then concentrated 5 times using 3 kDa-cutoff Amicon Ultra-15 centrifugal filters (Merck, US). After that, GCSF was conjugated with poly-ethylene glycol (5 kDa PEG) in a 1 ml reaction containing 1 mg GCSF, 2.65 mg monomethoxy-PEG (5 kDa mPEG) (Merck, US) and transglutaminase (TGase) (Ajinomoto, Japan). To determine the optimal condition for PEG conjugation to GCSF, three experiments were performed; first, the reaction was carried out with 0.05 mg/ml transglutaminase in phosphate buffer (pH=7.4) at 40°C for 240 min and 20 µl sample was withdrawn every 40 min to find the optimal time for the conjugation. Next, the reaction was carried out with 0.05 mg/ml transglutaminase in phosphate buffer (pH=7.4) at 5°C-45°C for the optimal time to find the optimal temperature. Finally, the reaction was carried out in phosphate buffer (pH=7.4) and miliQ (pH=6.8) with different concentrations of TGase at the optimal temperature for the optimal time to find the suitable buffer and TGase concentration for the conjugation. Ten microliters of each reaction (~10 µg protein) was loaded into SDS-PAGE gel to analyze the conjugation result.
Purification of PEGylated GCSF: Anion exchange chromatography: First, 5 ml Q sepharose fast flow column (GE healthcare, US) was used for the first purification step. The column was pre-equilibrated with binding buffer containing 20 mM Tris-HCl (pH=8.0). After that, 20 ml of dissolved GCSF solution was applied into the column and the column was then washed with 2 column volumes of binding buffer. Finally, protein was eluted by gradually increasing the proportion of elution buffer containing 20 mM Tris-HCl and 1 M NaCl (pH=8.0). All steps were performed at a flow velocity of 2 ml/min.
Size exclusion chromatography: A Superdex peptide 10/300 GL column (GE healthcare, US) was used for the second protein purification step. The column was first equilibrated with a mobile phase containing 10 mM ammonium bicarbonate (pH=8.0). After that, 10 ml of protein sample was loaded into the column and the mobile phase was allowed to continue moving through the column to separate proteins. All steps were performed at a flow velocity of 0.5 ml/min.
Ten microliters of each sample was used for SDS-PAGE analysis. The concentrations of total proteins in all fractions were determined by Bradford protein assay. The purity of monoPEG-GCSF was estimated using ImageJ software.
Identification of PEGylated GCSF: Measurements were performed on a Reflex time-of-flight instrument (Bruker-Franzen Ana-lytik, Ger-many). Sinapinic acid [Saturated solution in 0.1% TFA/Acetonitrile (70:30 v/v)] was used as a matrix solution. One milliliter of the sample solution (5 pmol/ml) was mixed with 4 μl of the matrix solution, and 1 µl of the resulting mixture was deposited on a sample holder and allowed to dry before introduction into the mass spectrometer.
Results and Discussion :
Production of GCSF during fermentation: According to some previous reports, GCSF could be expressed as ncIBs when E. coli cells were cultured at low temperatures 8,9. Therefore, to facilitate the formation of GCSF ncIBs, the fermentation was conducted at 25°C with good temperature control in a 1.5 L jar bioreactor. In addition, since the g-csf gene was placed under the control of T7 promoter in pET-43.1a(+) plasmid, 0.5 mM IPTG was added into the culture to induce the expression of GCSF.
During fermentation, cells showed a typical growth curve, with the lag phase within the first 4 hr, the exponential phase in the next 12 hr, and the stationary phase from the 16th hr (Figure 1A). Additionally, the western blot results showed that from the 6th hour, a clear protein band with the molecular weight between 14.4-20.1 kDa was detected by the anti-GCSF antibody (Figure 1B), indicating that GCSF was expressed during the fermentation. After 24 hr of fermentation, cells were obtained with the yield of 12.01±0.29 g/L dry weight.
Comparing the solubilities of ncIBs and cIBs in 0.1% N- lauroylsarcosine solution: Jevsevar et al previously reported that GCSF ncIBs can be easily dissolved in 0.1% N-lauroylsarcosine solution 8. Therefore, in this study, by comparing the solubilities of those aggregates and GCSF classical IBs (cIBs) in 0.1% N-lauroylsarcosine solution, it was verified that GCSF aggregates expressed during fermentation at 25°C were ncIBs. Since GCSF was expressed as cIBs at 37°C, this condition was applied when culturing the cells to produce GCSF cIBs 21-23. It was found that the solubility of ncIBs in 0.1% N-lauroylsarcosine solution was 5.93%, 10-fold higher than those of cIBs (0.59%) (Figure 2, Table 3). This result clearly demonstrated the difference between the structures of these IBs and thus suggested that the aggregates expressed at 25°C were ncIBs.
Evaluating the structure and bioactivity of dissolved GCSF: To examine the structures of dissolved GCSF proteins extracted from cIBs and ncIBs, Native-PAGE electrophoresis and RP-HPLC analysis were per-formed. The commercial Neupogen product (Amgen, USA) was used as a GCSF standard. The Native-PAGE result showed that a high amount of GCSF extracted from ncIBs migrated to the same position as the standard whereas only a faint band of GCSF extracted from cIBs was observed at this position (Figure 3). On the other hand, the RP-HPLC chromatogram showed that ncIBs-derived GCSF and GCSF in Neupogen product were eluted almost at the same time (26.6 min) (Figure 4). A peak at the same retention time could also be observed when analyzing the cIBs dissolving sample but this peak was significantly smaller than that of the ncIBs dissolving sample. Our quantification results based on the areas of GCSF peaks also verified the higher amount of GCSF in ncIB dissolving solution than in cIB dissolving solution. The concentration of correctly folded GCSF from ncIBs was 474.84 µg/ml, 56 folds higher than that from cIBs (8.44 µg/ml). These results clearly demonstrated that ncIBs contained a high amount of correctly folded GCSF which could be easily extracted by dissolving ncIBs in mild detergent solutions.
Next, the biological activity of the obtained GCSF was evaluated. The activity of GCSF was measured based on its ability to stimulate the growth of murine M-NSF-60 cell lines. It was found that the specific activity of GCSF extracted from cIBs was quite low (12.01±2.14 U/mg) (Table 4). This result indicates that although a small amount of GCSF could be extracted from cIBs, most of it did not possess a correctly folded structure and bioactivity. In contrast, the specific activity of GCSF extracted from ncIBs was significantly higher (70.24±5.95 U/mg), suggesting that most of the extracted GCSF was correctly folded and had high bioactivity. In total, the specific activity of GCSF dissolved from 1 g ncIBs was 4165.23±855.77 units, 58.7 folds higher than that of GCSF dissolved from 1 g cIBs (70.98±22.35 units). This is consistent with the result of RP-HPLC analysis, and taken together, these findings clearly demonstrated that the active GCSF can be efficiently extracted from ncIBs by mild detergent.
Optimizing the conditions for GCSF conjugation to 5 kDa PEG: In this experiment, the dissolved GCSF was conjugated with 5 kDa PEG by transglutaminase (TGase). This reaction would be affected by various factors, such as the amount of substrate and enzyme, buffer, reaction time, and temperature. First, a conjugation reaction containing 2.65 mg/ml 5 kDa PEG, 1 mg/ml GCSF, and 0.05 mg/ml transglutaminase was performed in phosphate buffer. Conjugation mixture was incubated at 40°C for 240 min and an aliquot of sample was withdrawn every 40 min to apply to SDS-PAGE analysis. The result showed that several protein bands were observed, suggesting that some types of PEG-conjugated GCSF were formed during the reaction (Figure 5A). It was predicted that the major band, which was the closest to the GCSF position, was the conjugation form of GCSF and one PEG molecule (monoPEG-GCSF), since the molecular weight of this band was around 24 kDa, equivalent to the sum of the molecular weights of GCSF and PEG molecules. The analysis on ImageJ software showed that the amount of monoPEG-GCSF gradually increased during the reaction, peaked at 160 min and decreased thereafter (Figure 5B).
According to the manufacturer (Ajinomoto, Japan), TGase exhibits the optimal activity at 40°C and the activity can be drastically reduced at temperatures above 50°C in food processing. Therefore, the optimal temperature for the conjugation was investigated by performing reactions at temperatures ranging from 5°C to 45°C. It was found that the activity of TGase was the highest at 25°C (Figure 6), indicating this temperature is the most suitable point for the conjugation reaction.
In a previous report, the conjugation reaction was performed in phosphate buffer 24. However, when adding TGase enzyme into phosphate buffer, the formation of precipitates was observed (Data not shown). It was not clear why precipitates were formed and whether the formation of precipitates would affect the reaction yield. Therefore, the efficiency of conjugation reaction in miliQ at pH=6.8 and in phosphate buffer at pH=7.4 was compared. The two reactions were incubated at 25°C for 160 min with different TGase concentrations ranging from 0.005 mg/ml to 0.05 mg/ml. Interestingly, it was found that the activity of TGase at low concentrations in miliQ buffer was much higher than in phosphate buffer (Figure 7A). At concentrations of TGase from 0.005 mg/ml to 0.01 mg/ml, no monoPEG-GCSF product was detected in phosphate buffer but quite high amount of the product was found in miliQ. The ImageJ analysis also revealed that there was no significant difference in the formation of monoPEG-GCSF in miliQ buffer when different concentrations of TGase were used (Figure 7B). Taken together, it seems that an optimal condition for PEGlyation reaction is temperature of 25°C, at pH=6.8 in miliQ for 160 min.
Purification of monoPEG-GCSF: Recombinant proteins, which are used for pharmaceutical purposes, require a high purity and must meet several requirements. Therefore, two steps of purification, including anion exchange chromatography and gel filtration chromatography, were applied to purify monoPEG-GCSF. The purity of monoPEG-GCSF was evaluated using ImageJ software.
The result of anion exchange purification showed that both GCSF and PEGylated GCSF could bind to the column since they were not observed in the flow-through fraction (Figure 8A). These proteins were eluted when the concentration of NaCl was increased, in which GCSF was eluted first at low NaCl concentrations (0.38 M and 0.40 M), following the elution of monoPEG-GCSF at higher NaCl concen-tration (0.42 M). After the first purification, the purity of monoPEG-GCSF was increased from 45.53±2.15% to 73.03±4.05% and a small amount of free GCSF was still present in the monoPEG-GCSF eluted fraction (Table 5).
To increase the purity of monoPEG-GCSF, a second purification step using gel filtration chromatography was used. Due to the 5 kDa difference between the molecular weights of GCSF and monoPEG-GCSF, the PEGylated form was efficiently separated from GCSF and reached a high purity of 96.23±0.93% after the purification (Figure 8B, Table 5). In general, monoPEG-GCSF was obtained with high purity using a two-step purification procedure with the overall yield of 11.17±0.19% (Table 5).
Identifying the form of obtained PEGylated GCSF: Next, the mass spectrometry as an analytical method was applied to demonstrate whether the purified product was monoPEG-GCSF. Three peaks corres-ponding to the three protein states as following were observed: 1) GCSF protein, about 18805 m/z, approximately 18.8 kDa; 2) +1 electric charge of monoPEG-GCSF, about 23780 m/z, approximately 23.8 kDa, corresponding to one 5 kDa PEG molecule fused with one GCSF molecule (18.8 kDa); and 3) oxidized impurity, about 11916 m/z, approximately 11.9 kDa (Figure 9). According to the result, although the purified product still contained a small amount of GCSF, our data demonstrated that monoPEG-GCSF was successfully acquired from ncIBs with high purity, which can be used for pharmaceutical purposes.
Conclusion :
In this study, GCSF was successfully obtained by dissolving ncIBs in mild detergent solution. The dissolved GCSF was then directly applied into a PEGylation reaction, which was catalyzed by TGase, in order to produce monoPEG-GCSF. There are many previous studies reporting the PEGylation of GCSF, but within the limits of our knowledge, the current study is the first report regarding the production of PEGylated GCSF using GCSF extracted from ncIBs. The PEGylated GCSF was then purified using anion exchange chromatography and gel filtration chromatography. PEGylated GCSF was obtained with high purity (~97%) and was demonstrated as a monoPEG-GCSF form, which contained one GCSF molecule and one 5 kDa PEG molecule demonstrated by mass spectrometry analysis. Although further experiments are required to optimize the conditions to produce monoPEG-GCSF, the results clearly indicated that the process developed in this study is a practical and simple approach to efficiently produce PEGylated GCSF.
Acknowledgement :
This study was supported by Vietnam National University, Ho Chi Minh city, Vietnam (Grant number: 562-2018-18-05).
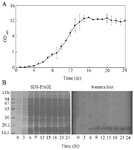
Figure 1. Growth curve of E. coli (A) and the SDS-PAGE and western blot results showing the expression of GCSF during fermenation (B). The fermentation was controlled at 25°C, DO >20%, 250 rpm, and pH=7.0. The expression of GCSF was induced by 0.5 mM IPTG. Data are shown as the mean±SD of three independent experiments.
|
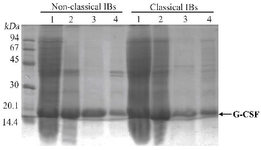
Figure 2. Solubilities of GCSF inclusion bodies expressed at 25°C (A) and at 37°C (B) in 0.1% N-laurylsarcosine solution. Samples are as follows: 1) total protein from E. coli cells after fermentation, 2) inclusion bodies before solubilization, 3) supernatant fraction after solubilization and centrifugation, and 4) pellet fraction after solubilization and centrifugation.
|
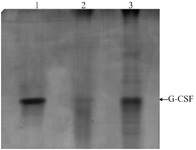
Figure 3. Native-PAGE analysis of GCSF samples. Samples are as follows: 1) Neupogen, 2) cIBs dissolving sample, 3) ncIBs dissolving sample.
|
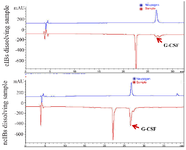
Figure 4. RP-HPLC analysis of GCSF samples.
|
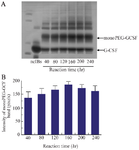
Figure 5. SDS-PAGE analysis showing the formation of PEGylated GCSF during the PEGylation reaction for 240 min (A) and the quantification of monoPEG-GCSF band intensity using ImageJ software (B). The reaction was performed with 0.05 mg/ml transglutaminase in phosphate buffer (pH=7.4) at 40°C. Data are shown as the mean±SD of three independent experiments.
|
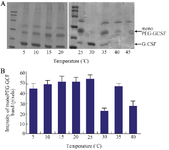
Figure 6. SDS-PAGE analysis showing the formation of PEGylated GCSF at different temperatures (A) and the quantification of mono-PEG-GCSF band intensity using ImageJ software (B). The reaction was performed with 0.05 mg/ml transglutaminase in phosphate buffer (pH=7.4) for 160 min. Data are shown as the mean±SD of three independent experiments.
|
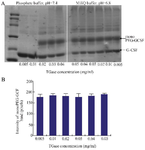
Figure 7. SDS-PAGE analysis showing the formation of PEGylated GCSF in phosphate buffer (pH=7.4) and miliQ (pH=6.8) using different enzyme concentrations (A) and the quantification of mono-PEG-GCSF band intensity of samples in miliQ using ImageJ soft-ware (B). The reaction was performed at 25°C for 160 min. Data are shown as the mean±SD of three independent experiments.
|
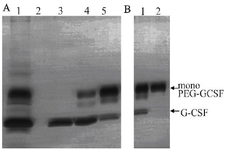
Figure 8. Purification of monoPEG-CSF. A) Anion exchange purification. Samples are as follows: 1) samples before purification, 2) flow-through fraction, and 3) elution peak 1 (~38 M NaCl)-4, elution peak 2 (~40 M NaCl)-4, elution peak 3 (~42 M NaCl). B) Gel filtration purification. Samples included samples before purification and monoPEG-GCSF containing fraction.
|
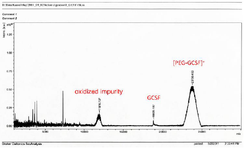
Figure 9. MALDI-TOF analysis of the purified PEGylated GCSF sample.
|
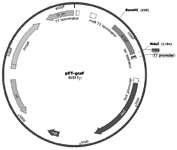
Figure S1. Schematic representation of recombinant plasmid pET-GCSF (Created with SnapGene®).
|
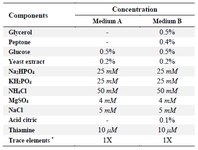
Table 1. Components of fermentation media
* Trace elements (1X): 10 μM FeCl3, 4 μM CaCl2, 2 μM ZnSO4, 2 μM MnSO4, 0.4 μM CoCl2, 0.4 μM CuCl2, 0.4 μM NiSO4, 0.4 μM Na2MoO4, 0.4 μM Na2SeO3, 0.4 μM H3BO4.
|
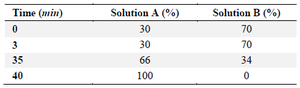
Table 2. RP-HPLC running program
|

Table 3. The solubilities of ncIBs and cIBs in 0.1% N-lauroylsarcosine
|
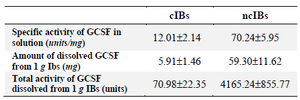
Table 4. Specific activity of dissolved GCSF from ncIBs and cIBs
|
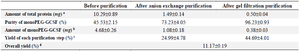
Table 5. Recovery yield of monoPEG-GCSF purification
a: (Amount of total protein) = (Total protein concentration) X (Sample volume)
b: (Amount of monoPEG-GCSF) = (Amount of total protein) X (Purity of monoPEG-GCSF)
c: (Yield of each purification step) = (Amount of monoPEG-GCSF obtained from this step)/(Amount of monoPEG-GCSF obtained from previous step) X 100%
d: (Overall yield)= (Yield of anion exchange purification) X (Yield of gel filtration purification).
|
|