Evaluation of Factors Affecting Size and Size Distribution of Chitosan-Electrosprayed Nanoparticles
-
Abyadeh, Morteza
-
Department of Medical Nanotechnology, Faculty of Advanced Technologies in Medicine, Tehran University of Medical Sciences, Tehran, Iran
-
Karimi Zarchi, Ali Akbar
-
Department of Medical Nanotechnology, Faculty of Advanced Technologies in Medicine, Tehran University of Medical Sciences, Tehran, Iran
-
Faramarzi, Mohammad Ali
-
Department of Pharmaceutical Biotechnology, Faculty of Pharmacy, Tehran University of Medical Sciences, Tehran, Iran
-
 Amani, Amir
Department of Medical Nano-technology, Faculty of Advanced Technologies in Medicine, Tehran University of Medical Sciences, Tehran, Iran, Tel/Fax: +98 21 88991118-20, E-mail: aamani@sina.tums.ac.ir
Amani, Amir
Department of Medical Nano-technology, Faculty of Advanced Technologies in Medicine, Tehran University of Medical Sciences, Tehran, Iran, Tel/Fax: +98 21 88991118-20, E-mail: aamani@sina.tums.ac.ir
-
Department of Medical Nanotechnology, Faculty of Advanced Technologies in Medicine, Tehran University of Medical Sciences, Tehran, Iran
Abstract: Background: Size and size distribution of polymeric nanoparticles have important effect on their properties for pharmaceutical application. In this study, Chitosan nanoparticles were prepared by electrospray method (electrohydrodynamic atomization) and parameters that simultaneously affect size and/or size distribution of chitosan nanoparticles were optimized.
Methods: Effect of formulation/processing three independent formulation/processing parameters, namely concentration, flow rate and applied voltage was investigated on particle size and size distribution of generated nanoparticles using a Box–Behnken experimental design.
Results: All the studied factors showed important effects on average size and size dis-tribution of nanoparticles. A decrease in size and size distribution was obtainable with decreasing flow rate and concentration and increasing applied voltage. Eventually, a sample with minimum size and polydispersity was obtained with polymer concentration, flow rate and applied voltage values of 0.5 %w/v, 0.05 ml/hr and 15 kV, respectively. The experimentally prepared nanoparticles, expected having lowest size and size distribution values had a size of 105 nm, size distribution of 36 and Zeta potential of 59.3 mV.
Conclusion: Results showed that optimum condition for production of chitosan nano-particles with the minimum size and narrow size distribution was a minimum value for flow rate and highest value for applied voltage along with an optimum chitosan concentration.
Introduction :
Biodegradable polymeric nanoparticles (NPs) have been used widely as drug carriers, especially for oral and pulmonary drug delivery purposes 1. Because of their small size, they can solubilize a concentrated payload of therapeutic agent, improve drug stability and bioavailability, and provide sustained delivery. Moreover, use of biodegradable and biocompatible materials decreases the risk of unwanted toxicities and adverse effects 2.
Natural polymers have been widely used as drug carrier in the literature. Chitosan (CS) is a natural polymer with properties such as biodegradability, biocompatibility, low toxicity 3, efficacious delivery of therapeutic agent 4, mucoadhesivity 5 and ability to facilitate the macromolecules permeation through the epithelia by opening tight junc-tions 6. Chitosan nanoparticles (NPs) are being extensively investigated for delivery of drugs, proteins/peptides and genes 7-9.
Recently, fabrication of polymeric NPs using electrospraying (electrohydrodynamic atomization) has received a great deal of attention for pharmaceutical purposes. Electrospray is based on the ability of electric field to create electrostatic forces within a liquid droplet to deform the droplet by repulsion between the coions. This results in an outwardly di-rected force when a charge is induced on the surface of the liquid 10. Fabrication of polymeric particles by electrospray has the potential to overcome limitations of other techniques to provide reproducibly loaded nano- and microparticles 11-14. Compared with approaches such as solvent evaporation and emulsification, electrospray has the advantages of narrower particle size distribution, higher drug-loading efficiency and lack of solvent residue 15,16. Additionally, this cost effective, simple and one-step technique does not require the use of template or surfactant and employs mild condition for sensitive therapeutic agents 17,18.
Size and size distribution of generated nanoparticles in electrospray method may be affected by many variables. By optimizing solution, process and environmental parameters, one may obtain a desired size and size distribution. No need to mention that size and size distribution of polymeric nanoparticles notably influence properties such as blood circulation time, bioavailability and cellular uptake 19-21. Few researches have studied parameters that affect size and/or size distribution of nanoparticles so far which are produced by electrospray. Size and size distribution of nanoparticles is greatly influenced by solution properties including polymer molecular weight 22, surface tension, conductivity, polymer concentration and acid concentration 1,23 as well as process parameters such as flow rate, needle gauge, applied voltage and distance between the electrodes 24. For instance, Enayati et al reported that lowest PLGA particle size and size distribution was obtained at concentration of 5 (%wt) in range of study (2% wt-10% wt) 25. In a study by our group, mean particle diameter decreased as both flow rate and polymer concentration were reduced 26. However, majority of such studies are PLGA-based reports. Very limited reports on chitosan are found which include chitosan/ ampicilin (520 nm) 27, doxorubicin/chitosan/tripolyphosphate (200 nm) 28, chitosan/indomethacin (340 nm) 22 as well as chitosan alone, (167 nm) 23 and (124 nm) 1. However, the result of investigation of parameters that simultaneously af-fect size and/or size distribution of chitosan nanoparticles produced with electrospray process has not been reported yet. More importantly, there is no detailed report focusing on size distribution of polymeric nanoparticles with this method.
Our investigation focused on the concurrent effect of three variables including polymer concentration, applied voltage and flow rate on nanoparticles size and size distribution to obtain the optimum conditions [(i.e. smaller size and nar-rowed Size Distribution (SD)].
Materials and Methods :
Materials: High molecular weight chitosan (CS) (MW=500 kDa, DD=85%) was purchased from Zhengzhou Sigma Chemical Co. (China). Acetic acid was purchased from Merck Chemicals (Germany).
Solution properties: 17 solutions of chitosan in aqueous acetic acid were prepared with a different chitosan concentration. Acetic acid concentration was fixed at 50% (v/v) in all samples.
Preparation of chitosan nanoparticles: To prepare chitosan nanoparticles, solutions with concentrations of 0.1, 0.4 and 0.7 (%w/v) were prepared by dissolving chitosan polymer into aqueous acetic acid solvent. The polymer solutions were stirred magnetically for 1 hr at room temperature before electrospraying. Then, the polymer solutions were transferred into a 2 ml plastic syringe and continuously forced through the spraying nozzle which was wired to the high voltage power supply (13, 14 and 15 kV) using a programmed pump (flow rate: 0.05, 0.2 and 0.35 ml/hr). For all samples, the needle gauge and the distance between nozzle and collector were kept at 27 g and 10 cm, respectively. Droplets were formed at the nozzle tip, in form of a cone called Taylor cone, when the electrical field overcame the surface tension of the polymer solution. The solvent was evaporated before reaching the collector to deposit the polymer in form of nanoparticles on the collector (i.e. alumina foil).
Particle size and zeta potential: Size and morphology of nanoparticles were determined by scanning electron microscopy (SEM) (ZEISS DSM 960A Oberkochen, Germany). Samples were sputter coated with gold (20 kV for 3 min). Zeta potential of optimized nanoparticle was measured using a Zetasizer (Nano-ZS, Malvern Instruments Ltd., UK).
Experimental design: Determination of the most important parameter and optimum level of each parameter with trial-and-error experiments is a time-consuming process. Therefore, Box-Behnken was employed as a response surface methodology (RSM) to optimize the three independent parameter levels. RSM is a statistical method for fitting the experimental data to a model for optimization 29.
Design-Expert (version 7.0.0, Stat-Ease, USA) was used to define the values of three independent parameters including applied voltage, chitosan concentration and flow rate in three levels as low (−1), basal (0) and high (+1), as given in table 1. Total number of experiments was 17, including 12 factorial points and 5 replicates at the center point for estimation of pure error sum of squares (Table 2).
Mathematical relationship of the response (Yi, particle size and size distribution) with the independent variables (Xi, concentration, applied voltage and flow rate) can be modeled by a second-order polynomial function model:
Y=β0+β1X1+β2X2+β3X3+β11X12+β22X22+β33X32+β12X1X2 +β13X1X3+β23X2X3 1.
where Y is the predicted response, β0, intercept, β1, β2 and β3, linear coefficients, β11, β22 and β33, squared coefficients and β12, β13 and β23, the interaction coefficients of the equation and X1, X2 and X3 are the independent variables.
Contour plots and 3D graphs were used to show the relationship and interaction of independent variables with the dependent response. Software-proposed optimized samples to prepare nanoparticles, considering minimum value for paticle size and size distribution were used to experimentally prepare the samples. The results were then compared with the predicted values by the software to investigate the ability of the model to estimate the optimum conditions.
Results :
Compared with conventional methods of generating aerosol droplets, electrospray is a straightforward technique which commonly produces less hetero-dispersed nanoparticles. In this approach, an electrical potential is applied on the nozzle. Above a certain critical charge, the electrical force overcame the liquid surface tension and broke the solution down to small electrically charged droplets that repel each other and produce a shower of fine polymer droplets 30. Nanoparticles with nearly monodispersed size distribution and spherical shapes can be produced by controlling the electrospraying parameters 2.
Different jet types may be obtained in an electrospary process; dripping, spindle, ramified-meniscus modes in low applied voltage and single cone-jet at an optimum voltage value as well as multi-jet at higher values are commonly observed. A stable single cone-jet mode is essential for production of nearly monodispersed micro- and nanoparticles 31.
Our experiments were performed at atmospheric pressure and room temperature. The simultaneous effect of three variable parameters on nanoparticles size and size distribution was investigated. Chitosan nanoparticles were prepared with size and size distribution ranging from 105 to 171 nm and 27 to 84 (Table 2), respectively. To obtain the best lack of fit and model F-values, quadratic second-order polynomial equation was used.
The equations fitted to the data were as follows:
Y1=+2386.92 +263.00X1-226.22X2-316.55X3 +211.11 X1 X2 -25.00 X1 X3+10.00 X2 X3+95.56 X12 +271.11X22 +11.10 X32 (2)
Y2=+1430.08+288.75 X1-401.67 X2 -191.29 X3-19.17 X1 X3+33.33 X2X3+6.54 X32 (3)
where Y1 and Y2 code size and size distribution and X1, X2 and X3 are concentration, flow rate and voltage, respectively. The coefficients of determination (R2) of the model for size and size distribution were 0.99 and 0.88, respectively, with adjusted R2 of 0.98 and 0.81, respectively, implying capability of the model to predict the two responses.
The lack of fit F-values model for the size and size distribution were 0.20 and 0.95, respectively, indicating insignificance relative to the pure error and significant models, respectively 32. ANOVA results for two responses are shown in tables 3 and 4. Three-dimensional response surface plots, generated by the software which indicates the relation of the independent variables with the responses, are demonstrated in figures 1 and 2. In each plot, the interaction of two independent variables is investigated simultaneously while the third variable is at its middle-level value.
Figure 1A shows the effect of applied voltage and concentration on the size of nanoparticles produced by electrospray. The findings show that particles size decreases with increase in applied voltage and decrease the concentration that is against the other report focusing on the role of applied voltage in spray mode and after forming stable cone jet, increase in applied voltage makes slight decrease in size of particles 2,25.
As shown, by increasing the concentration, the size increases. Literature shows that by manipulating chitosan concentration, some properties of the solution such as viscosity and conductivity 1 are influenced which in turn affects the droplets diameter. The relation is explained by an equation suggested by Hartman et al 32:
where d is the droplet diameter, α is a constant, ρ is the solution density,ε0 is the permittivity of vacuum, Q is the liquid flow rate , I is the current, γ is the surface tension in ambient air, and K is the liquid conductivity. From the equation, viscosity and conductivity have contrary impacts on the size. For instance, Zhang et al reported that increase in concentration of chitosan solution, increased the nanoparticles size as the increase in viscosity was more effective than increase in conductivity of solution 1.
Looking more closely to the diagram, in our work, decrease in chitosan concentration from 0.7 to 0.4 (%w/w) shows substantial decrease in nanoparticles size but decrease from 0.4 to 0.1 (%w/w) made no further decrease and even small increase in nanoparticles size. It is already reported that when chitosan concentration is low, changing the polymer concentration makes substantially more variation in viscosity compared with conductivity 1. So, at such situations, the decrease in viscosity as a function of decrease in chitosan concentration is more than that of conductivity. Thus, decrease in size is expected. However, further decrease in viscosity makes the electrospray process unstable, which could be an explanation to the observed size increase 33.
The second most important parameter after solution parameters in electrospraying process is probably flow rate 25, which together with solution parameters can control polymer entanglements and Coulomb fission; consequently, affect particles size and size distribution 2. As shown in figure 1B, in our study, reduction in flow rate makes decrease in particles size, as documented previously 34. When flow rate increases, the droplet size increases which makes faster movement of droplets towards the collector. Thus, solvent may not evaporate completely when reaches the collector. This makes agglomeration of wet nanoparticles which in turn leads to formation of larger particles 22,24.
From figure 1B, increasing the voltage from 13 to 15 kV makes a decrease in the size. This was described above and is in agreement with the previous results 24.
Figure 2 details the effect of independent variables on the size distribution. From figure 2A, voltage shows a reverse effect of size distribution. It seems applied voltage has important effect on size distribution of nanoparticles. Forming the stable single cone-jet mode is essential for near monodispersed nanoparticles production and can be obtained with optimized applied voltage. As other researchers showed, after forming stable cone jet, more increase in applied voltage makes multi-jet 24 appear in an irregular shape 27 and leads to increase in size distribution.
Also, as other researchers reported, size distribution of nanoparticles increases with increasing polymer concentration 26,27. Increase in concentration makes an increase in viscosity and decrease in conductivity as described above, makes cone jet unstable and leads to increase in size distribution.
Figure 2B indicates that decrease in flow rate makes an important decrease in size distribution. As other researchers show, the jet mode also depends on flow rate and increased flow rate needs increase in applied voltage to make cone jet mode stable that is essential for monodisperse particles formation 22.
Optimization: By solving equations 2 and 3 using the software, optimum values of 0.52 (%w/w), 0.05 (ml/hr) and 15 (kV) were given for chitosan concentration, flow rate and applied voltage, respectively. Using these values, 110 nm for size and 30 for size distribution were predicted by the software. Values were then used for experimental preparation of the samples. The results for three replicates were 110.6 (4.7) nm, 32 (5.8) and 59.3 mV for size, size distribution and zeta potential, respectively (Figure 3). These results show a good agreement between predicted value and obtained value.
Discussion :
Compared with conventional methods of generating aerosol droplets, electrospray is a straightforward technique which commonly produces less hetero-dispersed nanoparticles. In this approach, an electrical potential is applied on the nozzle. Above a certain critical charge the electrical force overcomes the liquid surface tension and breaks the solution down to small electrically charged droplets that repel each other and produce a shower of fine polymer droplets 31. Nanoparticles with nearly monodispersed size distribution and spherical shapes can be produced by controlling the electrospraying parameters 2.
Different jet types may be obtained in an electrospary process; dripping, spindle, ramified-meniscus modes in low applied voltage and single cone-jet at an optimum voltage value as well as multi-jet at higher values are commonly observed. A stable single cone-jet mode is essential for production of nearly monodispersed micro- and nanoparticles 32. Our experiments were performed at atmospheric pressure and room temperature.
Reviewing the graphs indicate that decreased size and narrow size distribution could be obtained with decreasing flow rate and concentration and increasing applied voltage.
As shown in figure 1A and figure 1B by increase applied voltage and decrease the concentration and flow rate, size decrease, that is against other report that most role of applied voltage is on spray mode and after forming stable cone jet increase in applied voltage make slight decrease in size of particles 2,24.
Literature shows that by manipulating chitosan concentration, some properties of the solution such as viscosity and conductivity 1 is influenced which in turn affects the droplets diameter. The relation is explained by an equation suggested by Hartman et al 32:
where d is the droplet diameter, α is a constant, ρ is the solution density, ε0 is the permittivity of vacuum, Q is the liquid flow rate , I is the current, γ is the surface tension in ambient air, and K is the liquid conductivity. From the equation, viscosity and conductivity have contrary impacts on the size. For instance, Zhang et al reported that increase in concentration of chitosan solution, increased the nanoparticles size as the increase in viscosity was more effective than increase in conductivity of solution 1.
Looking more closely to the diagram, in our work, decreases in chitosan concentration from 0.7 to 0.4 (%w/w) shows substantial decrease in nanoparticles size but decrease from 0.4 to 0.1 (%w/w) made no further decrease and even small increase in nanoparticles size. It is already reported that when chitosan concentration is low, changing the polymer concentration makes substantially more variation in viscosity compared with conductivity 1. So, at such situations, the decrease in viscosity as a function of decrease in chitosan concentration is more than that of conductivity. Thus, decrease in size is expected. However, further decrease in viscosity makes the electrospray process unstable, which could be an explain to the observed size increase 33.
The second most important parameter after solution parameters in electrospraying process is probably flow rate 24, which together with solution parameters can control polymer entanglements and Coulomb fission; consequently, affect particles size and size distribution 2. As shown in figure 1B, in our study reduction in flow rate makes decrease in particles size, as documented previously 34. When flow rate increases, the droplet size increases which makes faster movement of droplets towards the collector. Thus, solvent may not evaporate completely when reaches the collector. This makes agglomeration of wet nanoparticles which in turn leads to formation of larger particles 22,24.
As shown in figure 2A and 2B increase in applied voltage and decrease the concentration and flow rate makes decrease in size distribution.
Forming the stable single cone-jet mode is essential for near monodisperse nanoparticles production and can be obtained with optimize applied voltage. As other researcher showed after forming stable cone jet, more increase in applied voltage makes multi-jet 24, appear irregular shape 27 and leads to increase in size distribution. Also as other researcher reported size distribution of nanoparticles increase with increasing in polymer concentration 26,27. Increase in concentration make increase in viscosity and decrease in conductivity as above described, that make unstable cone jet and lead to increase in size distribution and as other researcher shows, the jet mode also depends on flow rate and increased flow rate needs increase in applied voltage to making stable cone jet mode that is essential for monodisperse particles formation 22.
Conclusion :
The aim of this study was to present optimized condition for production of solid chitosan nanoparticles using an elec-trospray device. The optimum condition for obtaining the minimum size and narrow size distribution was a minimum value for flow rate and highest value for applied voltage along with an optimum chitosan concentration. Afterwards, the optimum conditions were evaluated and solid chitosan nanoparticles were successfully prepared with size of 110.6 nm, size distribution of 32 and zeta potential of 59.3 by electrospray method which can be used for pharmaceutical applications.
Acknowledgement :
This research has been supported by Tehran University of Medical Sciences and Health Services grant No. 93-01-87-25230.
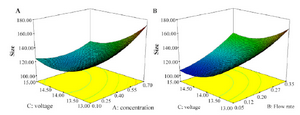
Figure 1. Effects of voltage and concentration; A) as well as voltage and flow rate; B) on size of nanoparticles.
|
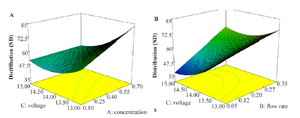
Figure 2. Effects of voltage and concentration: A) as well as voltage and flow rate; B) on nanoparticles size distribution.
|
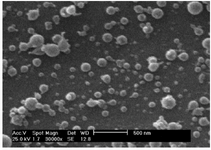
Figure 3. SEM image of chitosan nanoparticles
|
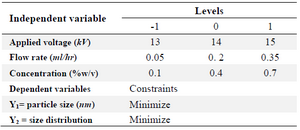
Table 1. Variables used in Box–Behnken design
|
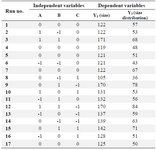
Table 2. Box–Behnken experimental design in 17 runs and the correspondent responses
A) Concentration; B) Flow rate; C) Voltage.
|
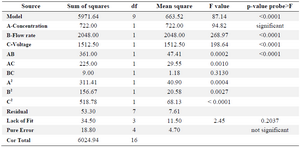
Table 3. ANOVA results for size as the responses
R-Squared 0.9912, Adj R-Squared 0.9798, Pred R-Squared 0.9035.
|
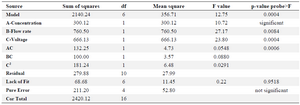
Table 4. ANOVA results for size distribution as the responses
R-Squared 0.8844, Adj R-Squared 0.8150, Pred R-Squared 0.7527
|
|