Simple Determination of Bosentan in Plasma Samples by Reversed-Phase High-Performance Liquid Chromatography
-
Khalighi , Zahra
-
Department of Internal Medicine, School of Medicine, Shahid Mustafa Khomeini Hospital, Ilam University of Medical Sciences, Ilam, Iran
-
Biotechnology and Medicinal Plants Research Center, School of Medicine, Ilam University of Medical Sciences, Ilam, Iran
-
Ghaneialvar, Hori
-
Biotechnology and Medicinal Plants Research Center, School of Medicine, Ilam University of Medical Sciences, Ilam, Iran
-
Department of Clinical Biochemistry, School of Medicine, Ilam University of Medical Sciences, Ilam, Iran
-
Soltani, Armin
-
Department of Internal Medicine, School of Medicine, Shahid Mustafa Khomeini Hospital, Ilam University of Medical Sciences, Ilam, Iran
-
Khorshidi, Ali
-
Department of Epidemiology and Biostatistics, School of Medicine, Ilam University of Medical Science, Ilam, Iran
-
 Karimi, Elahe
Biotechnology and Medicinal Plants Research Center, School of Medicine, Ilam University of Medical Sciences, Ilam, Iran, Tel: +98 84 3223081; Fax: +98 84 32223081; E-mail: ilamfarma@gmail.com, Karimi-e@medilam.ac.ir
Karimi, Elahe
Biotechnology and Medicinal Plants Research Center, School of Medicine, Ilam University of Medical Sciences, Ilam, Iran, Tel: +98 84 3223081; Fax: +98 84 32223081; E-mail: ilamfarma@gmail.com, Karimi-e@medilam.ac.ir
-
Moayeri, Ardeshir
-
Department of Anatomy, School of Medicine, Ilam University of Medical Sciences, Ilam, Iran
-
Abbasi , Naser
-
Biotechnology and Medicinal Plants Research Center, School of Medicine, Ilam University of Medical Sciences, Ilam, Iran
-
Department of Pharmacology, School of Medicine, Ilam University of Medical Sciences, Ilam, Iran
-
Tahmasebi, Masoumeh
-
Department of Emergency Medicine, School of Medicine, Ilam University of Medical Sciences, Ilam, Iran
-
Aidy, Ali
Department of Medical Biotechnology, School of Advanced Technologies in Medicine, Shahid Beheshti University of Medical Sciences, Tehran, Iran, Tel: +98 84 3223081; Fax: +98 84 32223081; E-mail: ilamfarma@gmail.com, Karimi-e@medilam.ac.ir
Abstract: Background: In order to measure the plasma levels of Losartan and Bosentan, a sensitive Reverse Phase-High Performance Liquid Chromatography (RP-HPLC) technique was developed.
Methods: To compare bioavailability, the Area Under the Curve (AUC), peak plasma concentration (Cmax), and time to Cmax (Tmax) were employed. The standard curve (150-2400 ng/ml) was linear (R2=0.999), relative errors were between 2.4 to 10.05% and the coefficient of variation (CV%) ranged from 1.52 to 10.88. A single dosage (test and reference) was used for the in vivo investigation, which involved 16 healthy individuals.
Results: The AUC0-48, AUC0-, Cmax, and Tmax of the test and reference had no statistically significant differences. The Cmax and 95% confidence intervals of the ratio of Cmax of the two formulations were 0.93-0.96 and 97.6-135%, respectively.
Conclusion: Therefore, it was established that generic Bosentan was equivalent to Bosentan from Actelion and that both medications could be regarded as equally effective in clinical settings. The blood level of Bosentan could be measured using this straightforward procedure in all hospital laboratories.
Introduction :
Bosentan, whose chemical formula is 4-tert-butyl-N-[6-(2-hydroxy-ethoxy)-5-(2methoxyphenoxy)-2-pyrimidin-2-ylpyrimidin-4-yl]benzenesulfonamide hydrate (C27 H29N5O6S• H2O), is one of the endothelin receptor antagonists (Figure 1). This drug treats chronic heart failure and Pulmonary Arterial Hypertension (PAH). Endothelin 1 acts on Endothelin A (ETA) and Endothelin B (ETB) receptors in the smooth muscles of pulmonary blood arteries, which this drug antagonizes in a competitive and specific manner, thus inducing significant vasoconstriction 1,2. Bosentan's affinity for ETA receptors is somewhat greater than for ETB receptors 3. The amount of Bosentan in biological samples has been estimated using methods such as gradient Reverse Phase-High Performance Liquid Chromatography (RP-HPLC), Solid Phase Extraction Liquid Chromatography-tandem Mass Spectrometry (SPE-LC-MS/MS), and UV-visible spectrophotometric methods, which are costly and challenging to implement 4-8.
Losartan is one of the less expensive medications frequently used to treat hypertension. Additionally, it can be used with Bosentan to improve PAH 9. Several methods have been demonstrated for the Losartan potassium determination substance in tablets including Supercritical Fluid Chromatography (SFC), Capillary Electrophoresis (CE) 10, and High-Performance Thin-Layer Chromatography (HPTLC) 11. In biological samples, the active component has been determined by HPLC, UV detection 12, fluorescence detection 13, and liquid chromatography-electrospray ionization tandem mass spectrometry 14.
For the purpose of analysing Bosentan in bodily fluids, many HPLC techniques have been reported 15-17. Bioavailability is the proportion of the drug that reaches the circulation after passing through the barriers to absorption and metabolism 18. Because the characteristics of body structure vary from person to person in terms of absorption and metabolism, it is important to measure the bioavailability of drugs, even for similar medications 19.
The objective of this work was to develop a straightforward, quick, sensitive, economical, specific, and reliable HPLC assay for the quantitation of Bosentan concentrations in plasma. A bioavailability study was carried out using the established methodology. So, a further aim of the present study was to compare the relative bioavailability of generic Bosentan tablet preparation, manufactured by Osve Pharmaceutical Company, an Iranian pharmaceutical company, with that of the Tracleer® (125 mg tablet, Actelion) and quantify Bosentan at the same time with internal standard Losartan.
Materials and Methods :
Reagents: Bosentan (125-mg tablets, Batch Num: 019) was purchased from Osve Pharmaceutical Company, Iran, and Tracleer® (Actelion). The standard Bosentan and Losartan and all solvents and chemicals (HPLC GRADE) were purchased from Sigma (Missouri, USA), and Merck (Germany).
Chromatographic conditions: The analysis was performed with HPLC equipped with a PDA detector and a binary dual pump. After selecting the appropriate internal standard and wavelength, the other parameters of the HPLC method were investigated. A German-made C18 column (250×4.6 mm, Knauer, Platin blue, Germany). was used for chromatographic separation. The mobile phase included methanol with a pH of 6.4 and 0.1% formic acid. The injection loop capacity was 50 µl, the mobile phase flow rate was 1 ml/min, and the effluent was seen at 270 nm. The drug peak area ratios to the internal standard Losartan measurement were used to accomplish quantification.
Calibration procedure: To create concentrations of 150, 300, 600, 1200, and 2400 ng/ml, respectively, drug-free plasma (1 ml), 20 µl of internal standard (Losartan, 100 µg/ml), and volumes of 2, 4, 8, 16, and 24 µl of standard Bosentan solution (1 mg/ml, 75 µg) were added to each capped tube. The 100 ml of sample plasma was then mixed with 200 ml of acetonitrile, vortexed for one min with a stirrer, then centrifuged at 12000 rpm for ten min. The mean peak area ratios of the drug were chosen as the device response after isolating and filtering, and 50 µl of the supernatant was then injected into the device (three times). At 150-2400 ng/ml Bosentan, a linear relationship between concentration and method response was seen. The coordinates of the linear regression analysis are as follows:
y = 2745.x – 4123
R² = 0.999
Precision: Within-day variability: The same drug concentrations used in the standard curve were produced for plasma. On the same day, preparations were made and injections into the HPLC column were made of five samples of each concentration (150, 300, 600, 1200, and 2400 ng/ml, Losartan, 100 µg/ml; respectively) (Table 1A).
Between-day variability: Losartan was synthesised at concentrations of 150, 300, 600, 1200, and 2400 ng/ml, and five replicates of each concentration were monitored daily for four days in a row. Each sample was injected into the HPLC column in a volume of 50 µl. The standard curve equation was then used to compute the equivalent concentration for each sample, and the precision and accuracy of the procedure were determined by the percentage of variation coefficient and error percentage (Table 1B).
Limit of Quantitation (LOQ) and Limit of Detection (LOD): By comparing the signal-to-noise ratio with known analyte concentrations to the outcomes of the blank sample, LOQ and LOD indices were calculated. The following was found to be the error % and variance coefficient percentage:
a) 100 [actual concentration/(actual concentration-calculated concentration)]=error percentage
b) 100 (mean/standard deviation)=percentage of variation
The same calibration curve concentrations (150, 300, 600, 1200, and 2400 ng/ml, Losartan, 100 μg/ml) were prepared. The samples were dissolved in 100 µl mobile phase before being injected into the HPLC five times with 50 µl each. Free plasma samples-those devoid of medication and internal standards-were then made into a matrix. Then, a drug aqueous solution was added to each tube, and injections were given at doses of 0.625, 1.25, 1.87, 2.5, 5, 7.5, and 10 µg/ml.
In vivo study design: Losartan at five distinct drug concentrations in plasma (150, 300, 600, 1200, and 2400 ng/ml, Losartan, 100 μg/ml) were prepared and injected into HPLC. A matrix similarity test was also conducted. The tubes were then filled with a 50 µl aqueous solution of the medication, which was then injected. The below curve area was then read, and the extraction % was computed. The volunteer sample tubes were submerged in a 37°C, 10 min hot water bath. The internal standard solution (50 µl) was added to 0.5 ml of the plasma samples before being centrifuged. Each tube was then filled with 5 ml of dichloromethane, vortexed for 2 min, then centrifuged at 8,000 rpm. Following the aspiration of the aqueous phase and the nitrogen gas flow separation of the organic phase, 200 µl of the mobile phase was added and mixed for 30 s. The prepared sample (50 µl) was injected, and the sample concentration was calculated by comparing the internal standard to the drug's sub-peak level and dividing by the standard curve.
Bioavailability: The human studies ethics committee of the Ilam University of Medical Sciences has given the study approval (Ethical code: IR.MEDILAM.REC. 1398.78). 32 participants were chosen, all of them were between the ages of 20 and 30. The use of different drugs were prohibited for the participants' for two weeks before to and throughout the test.
Numerous clinical and paraclinical assays were performed, including urea, creatinine, alkaline phosphatase, SGOT, SGPT, and FBS. After fasting for the previous night, a blood sample was collected (control at time zero) prior to receiving the single dose of the pill. Next, a four-hour food restriction (save for water) and a 125 mg Bosentan pill were given to each participant. Blood samples were collected at 0.5, 1.5, 3, 6, 8, 12, 18, 24, and 48 hr after receiving a single dosage of the medication. 32 individuals had their blood tested to determine the drug's maximum plasma concentration (Cmax) (measurement was done at the Cmax time).
Analysis of pharmacokinetic: Area Under the Curve (AUC) AUC0-12, peak plasma concentration (Cmax), AUC0-∞, time to Cmax (Tmax) and T1/2 were computed after analysing the volunteer's plasma samples using the standard curve by HPLC using the non-compartmental technique. The slope of the natural logarithm (ln) curve, plotting the drug plasma concentration across time was used to determine the elimination rate constant (Kel). By dividing 0.693 by Kel, the drug's elimination half-life was estimated. The linear trapezoidal rule was used to calculate the AUC to the last plasma concentration (AUC0-t). The formula for calculating the area under the extrapolated curve to infinity (AUC0-¥) is AUC0-t + Ct/kE, where Ct is the last concentration that can be measured. Examination of the individual drug plasma concentration-time profiles led to the determination of Cmax and Tmax.
Statistical analysis: AUC 0-t, AUC 0-∞, and C max were regarded as key variables for bioequivalence study. To evaluate the impact of formulations, times, sequences, and participants on these parameters, a two-way ANOVA for crossover design was employed. For a p-value of 0.05 or below, a difference between two related values was deemed statistically significant. The 90% confidence intervals of the ratio of pharmacokinetic parameters of test to reference products as well as those which were transformed logarithmically were also estimated 20. Using SPSS 10, all statistical analyses were carried out.
Results :
HPLC assay: Human plasma chromatograms in blank form are shown in figure 2. The Bosentan ratio to Losartan sub-peak level by HPLC was plotted against standard concentrations (150, 300, 600, 1200, and 2400 ng/ml) using the standard curve (y=2745. x-4123.9, R2=0.9995). There was no interference at the Bosentan or Losartan retention times. To determine the peak height or peak area of standard curves, two distinct resolved peaks without peak tailing formed after elution. Retention times for Losartan and Bosentan were 4.863 and 2.827 min, respectively at the mobile phase optimum flow rate (1 ml/min). The minimum diagnosable concentration after testing the descending series of the concentration of Bosentan was a concentration with less than 20% error, which was calculated to be 75 ng/ml (Figure 3). Figure 4 shows the concentration of Bosentan in the plasma of a healthy subject after 4.5 hr ingestion of Bosentan tablets.
Within- and between-day variability: The findings of the intra- and inter-day variability are shown in the table 1. Within 2.4 to 10.05% and 1.52 to 10.88, respectively, were the relative errors and CV% . Table 2 displays the findings of solvent-based drug extraction from plasma. More than 93% of the medication is extracted at all concentrations.
In vivo studies: The physical health of the volunteers was assessed throughout the whole trial, and those who had any disorders were disqualified. Figure 5 depicts the mean concentration-time profile following oral administration of Bosentan Tracleer® (Actelion) and (Osve). Table 3 provides a summary of the mean pharmacokinetic parameters for two different brands of Bosentan. The maximum plasma concentration (Cmax), as determined by the HPLC data, is attained around 3 hr after oral administration. No discernible difference between the two formulations was seen after data log transformation (p>0.05). The ratio of Cmax for the two formulations' 95 percent confidence intervals ranged from 97.6 to 135% (Table 3).
Discussion :
Bosentan, a non-peptidic endothelin receptor antagonist, is one of the drugs used to treat hypertension and chronic heart failure 21. Daily drug usage can lead to drug buildup in the blood, interact with other medicines, and have negative consequences 22. Therapeutic Drug Monitoring (TDM), which can change the pharmacokinetics of the drug in clinical settings, is therefore one of the ways to determine the therapeutic and adverse effects of pharmaceuticals 23. Bosentan plasma concentrations have been determined using several techniques, including LC-MS/MS 4,24-27. Even though Bosentan plasma determination has been previously reported by HPLC 28,29. Although the new HPLC machines have high repeatability injectors, the internal standard technique is utilized to mitigate the error of sample preparation and injection 30, However, it is crucial to establish a novel approach in order to more accurately detect Bosentan in plasma. Etodolac has been used as an internal standard to measure Bosentan in plasma in previous studies 31. One of the most important uses of Bosentan is to control pulmonary blood pressure, and most patients use Losartan to control blood pressure, therefore, in this work Losartan was used as an internal standard 15. Losartan (RT=4.863) and Bosentan (RT=2.827) chromatograms in this investigation lacked any interferences. When the peak area ratios of Bosentan to Losartan were plotted vs. the plasma concentration of Bosentan (150–2400 ng/ml, R2=0.9995), a linear relationship was seen.
In this study the Bosentan detection limit was about 50 ng/ml (signal-to-noise ratio of 3:1) and the quantitation limit with a coefficient of variation of less than 10% was 300 ng/ml using a 0.5 ml plasma sample which was comparable to previously reported methods using differential pulse voltammetry 32,33, UHPLC UV method 34 or UV-visible spectrophotometer 35. Bosentan was detectable in all individuals at the initial sample time (30 min) and five half-lives. An essential aspect of HPLC test is assay accuracy, which is increased by using internal standards. While reliability is the amount of inaccuracy between measurements, repeatability may be thought of separately under identical settings as the repeat estimations were done on a comparable subject 36. It is inevitable that there will be some inaccuracy in clinical measures, and the acceptable level will depend on particular circumstances 37-39. The right statistical methods to determine this kind of repeatability are frequently ineffectual and have the potential to confuse and mislead therapeutic decision-making 40.
In the current investigation, 32 healthy volunteers who participated in a cross-over trial and administered 125 mg of Bosentan orally had their plasma concentrations measured. The results show that following oral drug administration, Cmax was attained in 2.8 hr at 1656.4±120.4 (test) and 1631.8±105.1 µg/ml (reference), and no significant difference was seen.
The two oral formulations' Cmax 95% confidence intervals ratio was 97 to 135%. Consistent with the findings of this investigation, Tmax and AUC0-∞ correspond to the respective rate and extent of drug absorption, and Cmax is related to both of these two processes 41. Thus, in order to compare the bioavailability of the two oral final products, all indicated criteria were required between the test and reference AUC0-48, and AUC0-¥ values, there was no statistically significant difference. For the test and form reference, the AUC extrapolated percent (comparing AUC0-48 to AUC0-¥) was 4.37 and 4.38%, respectively. Therefore, the research design was sufficient to assess more than 90% of the AUC utilising the 48-hr sampling period. The AUC0-48 and AUC0-¥ for the two products did not differ significantly, indicating that the plasma profiles created by Tracleer® and Bosentan made by Osve Company were similar.
Conclusion :
In conclusion, the devised approach was delicate enough to be used to the bioequivalence of Bosentan. According to estimated findings, Tracleer®, a product made by Actelion, and Bosentan tablets made by Osve Company are bioequivalent and both can be thought of as equally effective in clinical settings.
Acknowledgement :
This study was supported by the Ilam University of Medical Sciences. The human studies ethics committee of the Ilam University of Medical Sciences has given the study approval (Ethical code: IR.MEDILAM.REC. 1398.78).
Conflict of Interest :
The authors declare no conflict of interest.
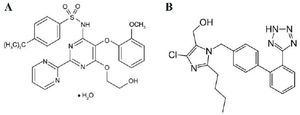
Figure 1. Chemical structure of Bosentan (A) and Losartan (B).
|
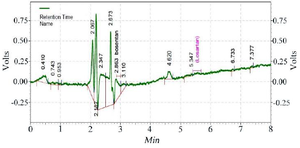
Figure 2. Chromatogram of the blank sample.
|
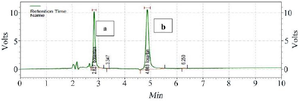
Figure 3. Chromatogram of the standard sample containing Bosentan (a) and internal standard Losartan (b) at a concentration of 100 ng/ml.
|
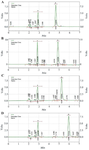
Figure 4. Chromatograms of the volunteers' serum sample analysis (A, B, C, D) containing Bosentan (a) and internal standard Losartan (b) 4.5 hr after ingestion of Bosentan tablet.
|
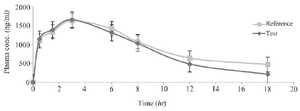
Figure 5. The mean plasma Bosentan levels vs. time profiles following ingestion of a single dose of two 125 mg for a reference (Tracleer®) and test (Osve) products to 32 healthy volunteers. Data are shown as mean±SD.
|
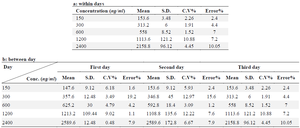
Table 1. Within- and between-days variability for determination of Bosentan in human plasma, a: between days, b: within days
|
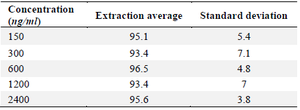
Table 2. Bosentan extraction percentage from plasma samples
|
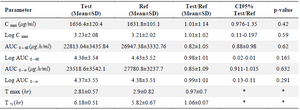
Table 3. Plasma concentration after oral administration of Bosentan and Tracleer® (125 mg)
|
|